How to Analyse Flows and Events
Flow Analysis
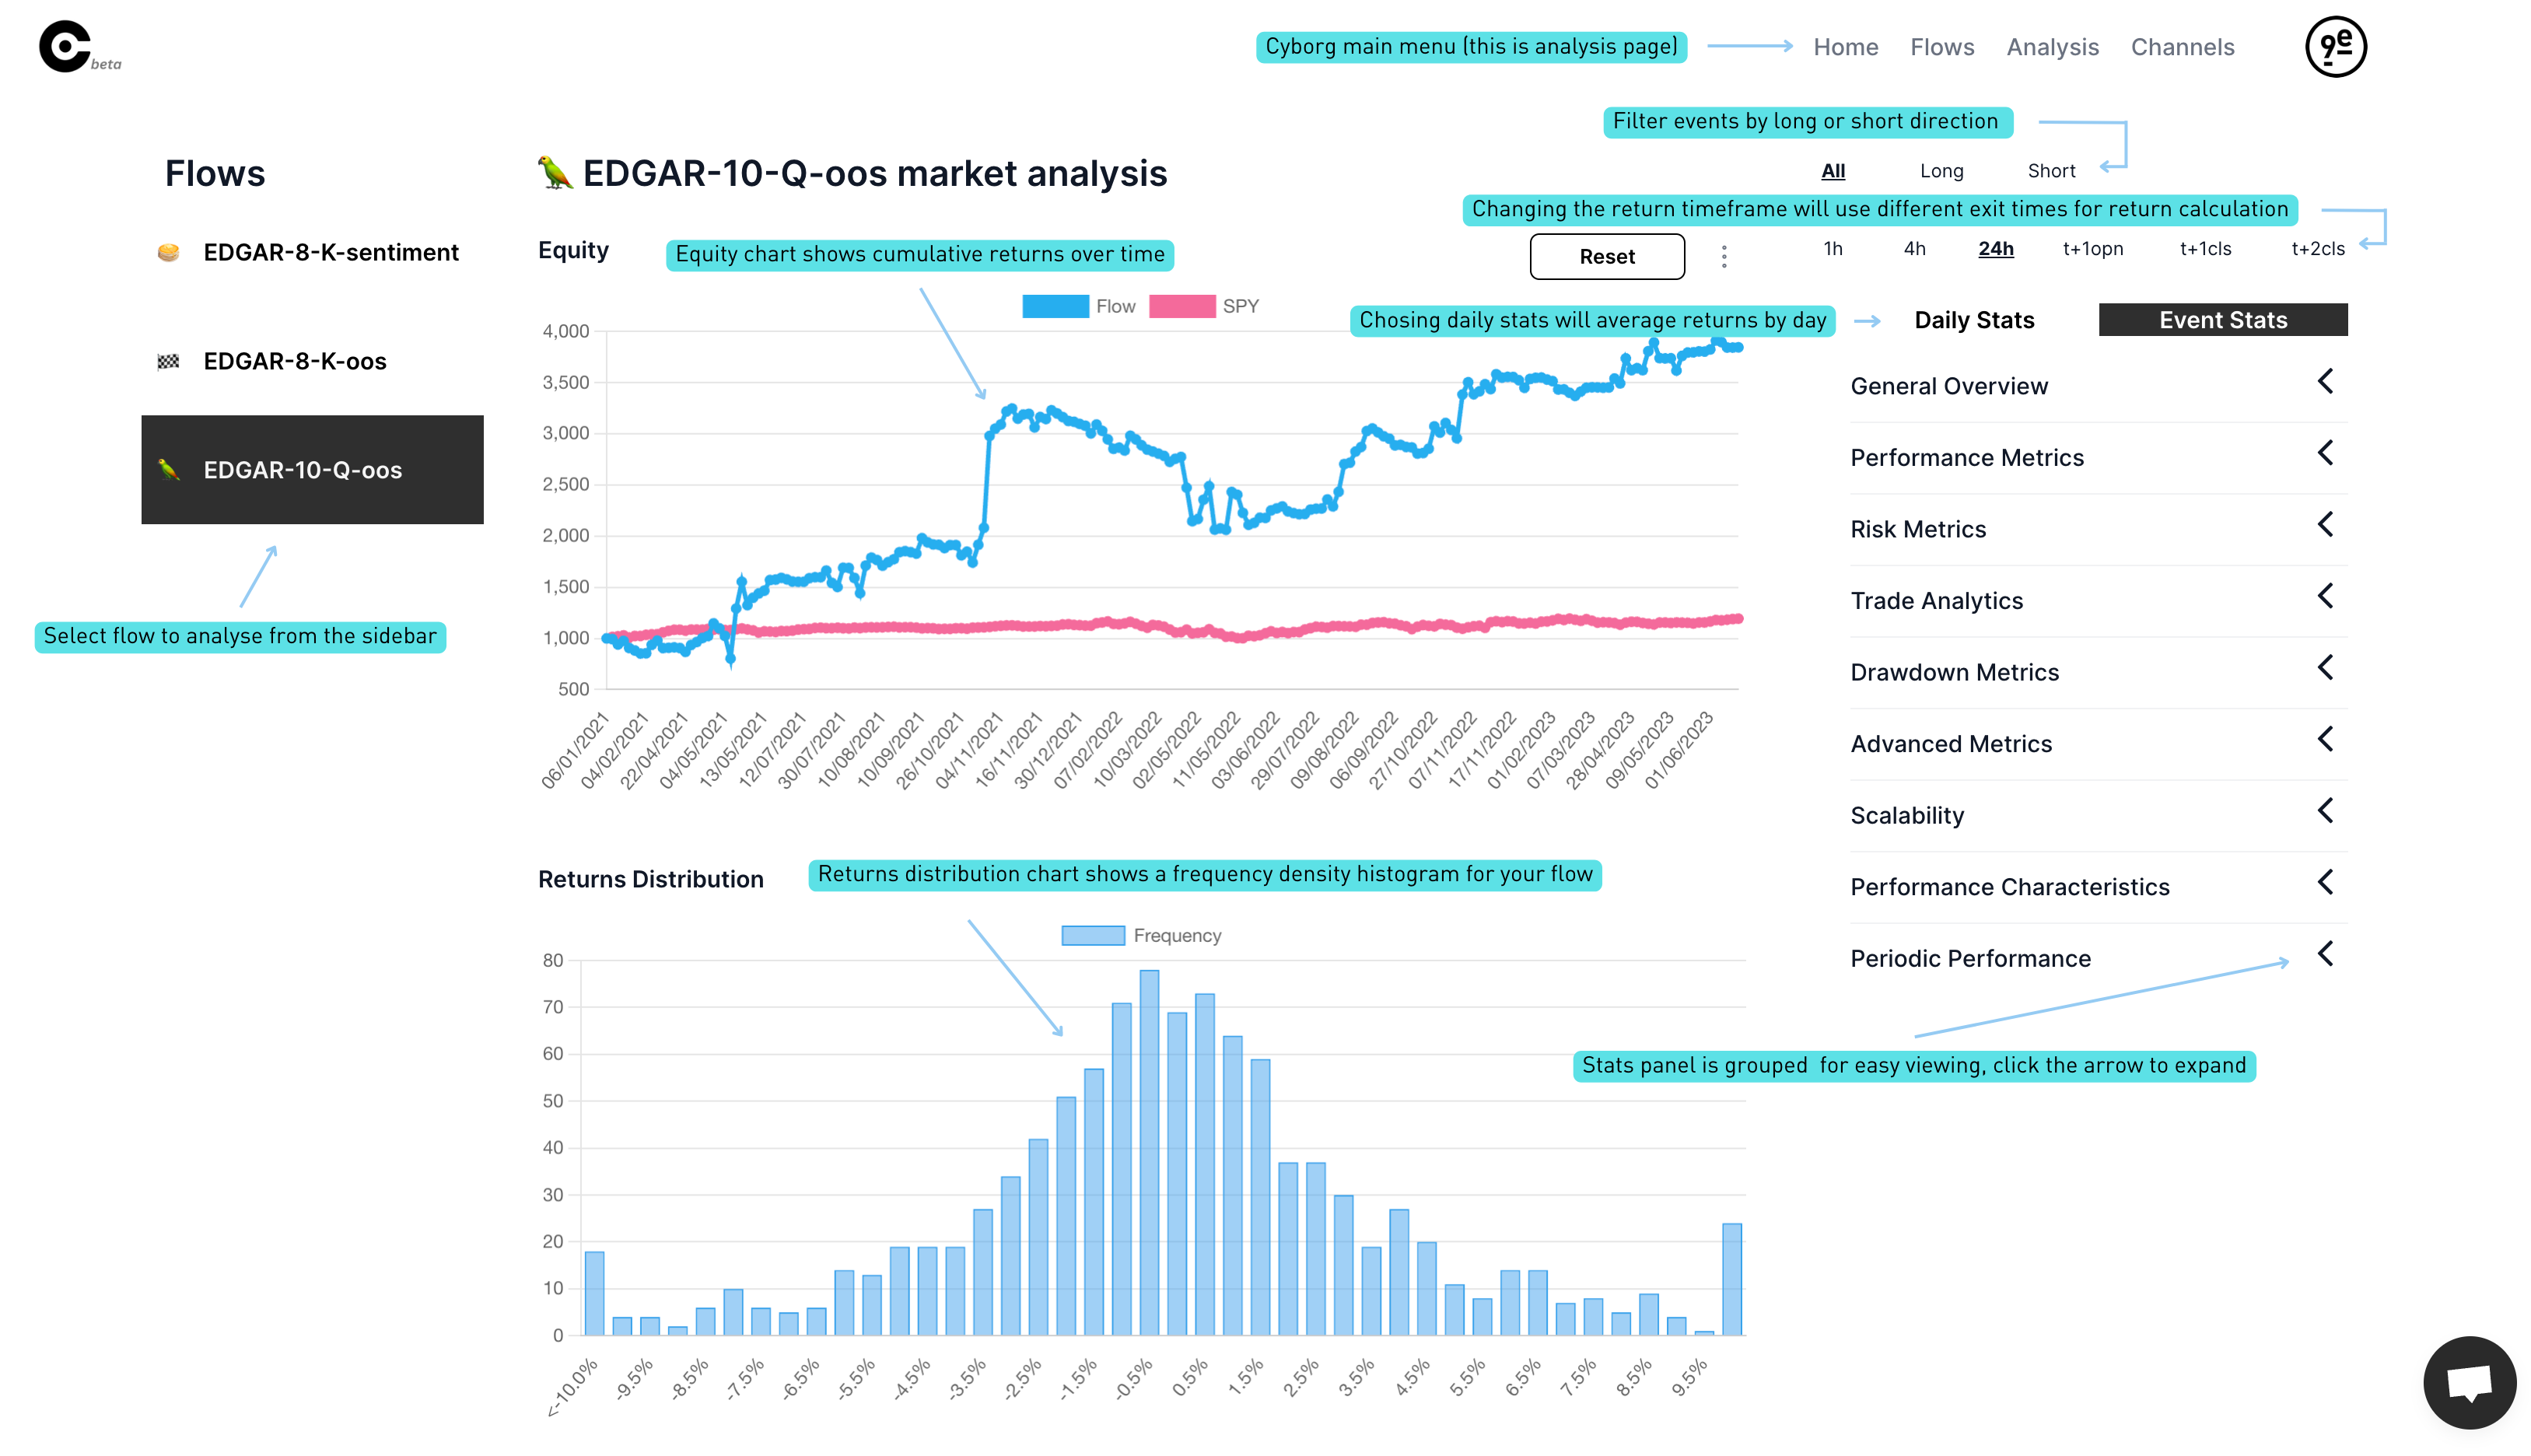
Over on the analysis page, which can be found via the Analysis button at the top of every page, we can see various statistics about our flow over time.

Here we can see:
- An equity chart, which indicates the profit and loss of your flow over time.
- A returns distribution, which shows the approximate size and frequency of the returns of your flow.
- A table of statistics, categorised into types. There are both statistics analysed by day, and by trade.
All elements are dependent on the options that can be found above the table, towards the upper right-hand corner of the page. The top row filters the signals by direction and shows All, Long, and Short trades.
The bottom row indicates the length of holding for your strategy.
- 1h: 1 hour
- 4h: 4 hours
- 24h: 24 hours
- t+1opn: Hold until the next daily open
- t+1cls: Hold until tomorrows daily close
- Portfolio: Exit time is defined by reverse signal (enterprise only)
You can select either Daily or Event analysis option. Daily will run all stats and charts using daily average returns whereas event stats will be weighted by individual event. Daily is useful if you assume you have a fixed amount of capital available per day.
Statistics Tables
The stats table is grouped into expandable sections, mousing over the statistics shows a tooltip that gives a short description.
Event Analysis
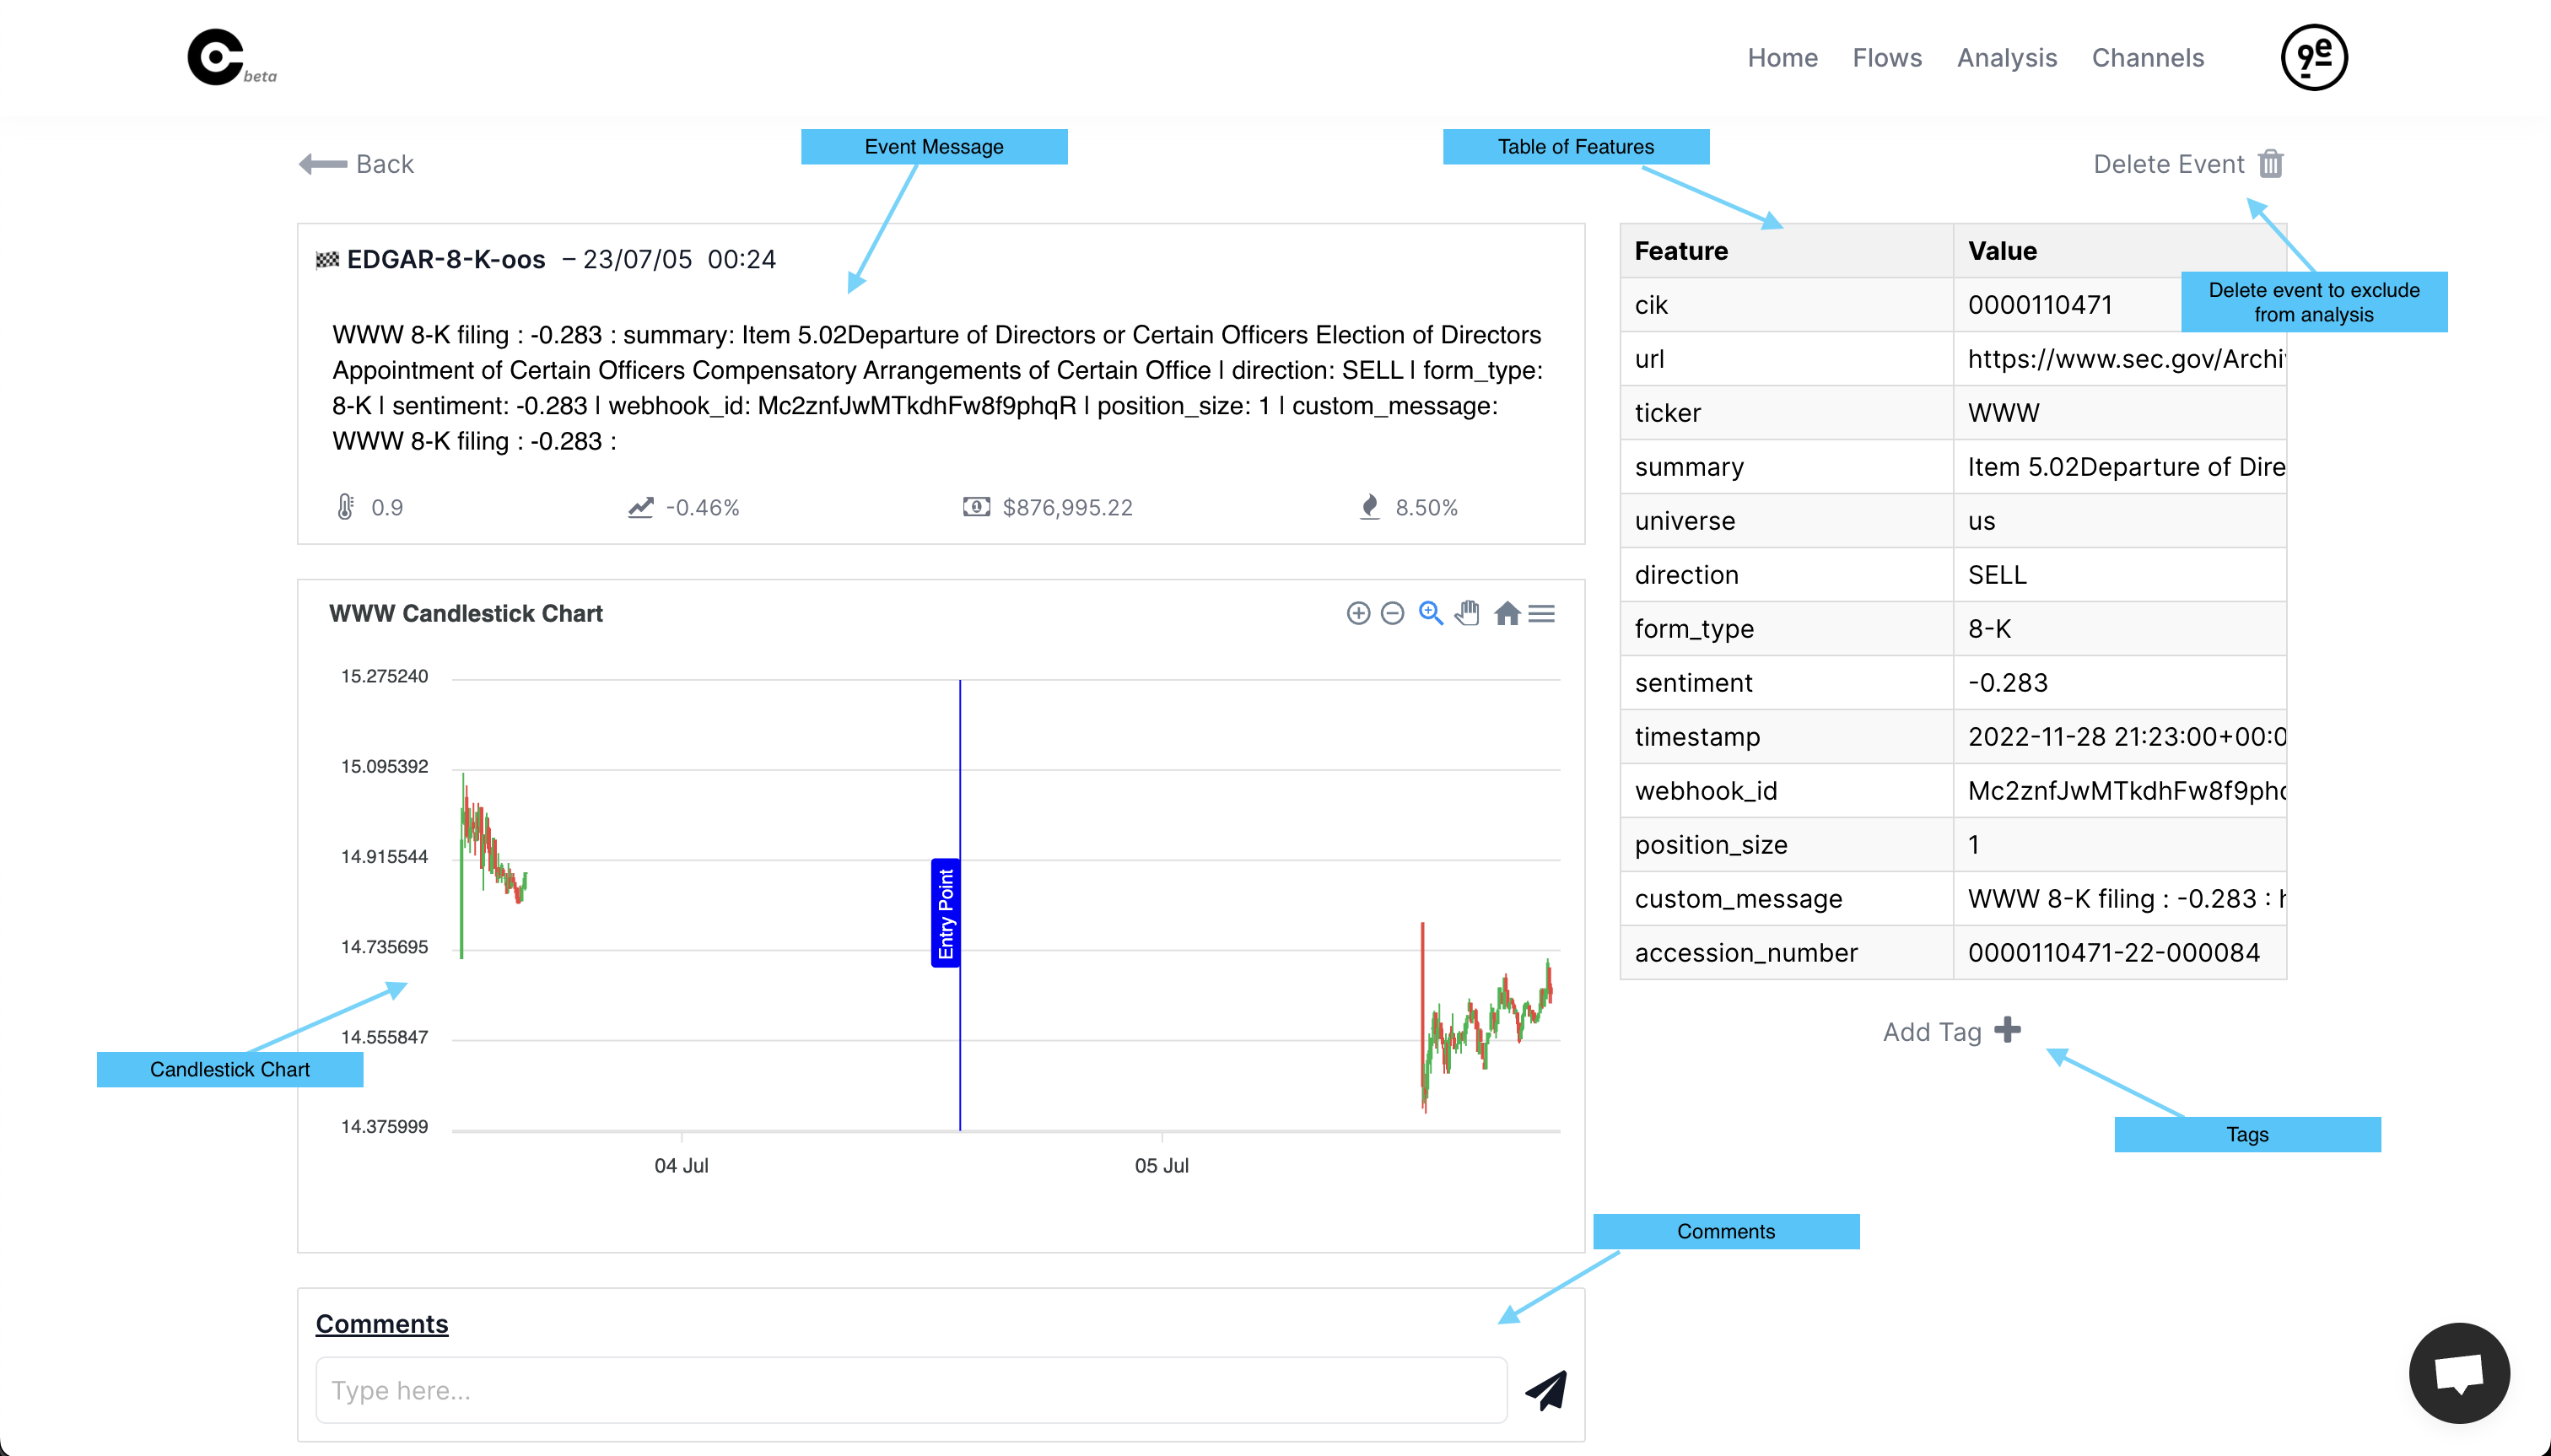
We can take a look at specific event by clicking on one via the Home page. Here you will be presented with a page that contains a few elements relating to your event.
Event Overview: Contains the event message and some statistics such as the RVOL of the given ticker.
Candlestick Chart: A price candlestick chart of the ticker to which the event relates. The time the event occurred will be marked with an arrow, so you can get a basic overview of the effect of the event on the price of the security. Note that if the event occurred today, no candlestick chart will be shown.
Comments: An area for you to leave any comments you may have about the event. Comments can be used for you to jot down any thoughts you wish to remember about that event if you choose to come back and view it again at a later time.
Features: Any features relating to the event.
Tags: A table of key value pairs that can be used to keep track of events and filter using custom metrics. An example of a tag may be to rank events by your confidence that they will lead to profit. In this case, you may create a tag called "confidence" with a value of 8. It's up to you how you want to use these tags, and their values may be numbers or text.
Delete Event Button: Allows you to effectively delete an event from the flow. A deleted event will no longer be included in the analysis of the flow.