Alpha Signals Tutorial
How to research alt-data alpha signals using Cyborg & python
Alpha signals is an aspect of quantitative finance concerned with the discovery of factors/features that can provide increased returns independent to a benchmark or market return. Ideas for alpha signals are often the necessary first part of a strategy and can come from market observations (screen time) or broker/academic papers.
Full python github repo here: https://github.com/9epoch/cyborg-edgar-tutorial
In this example we are going to:
- Query the EDGAR public database of unstructured US company information with python
- Extract quantitative features from the data with a sentiment model
- Examine the relationship between the sentiment and post-ante stock returns using Cyborg
EDGAR data as an alpha signal - hypothesis
Our idea comes from the observation that smaller listed US company's release news (very positive or very negative) which can fly under the radar. The stock price of these companies may not instantly or accurately adjust to incorporate EDGAR releases. The reasons for this are likely to be:
- Investors have limited attention for smaller cap companies that may make up a very small % of portfolio
- Liquidity is restricted so larger investors will have to enter/exit over a longer period of time (hours/days)
- Investors are waiting for others to evaluate the news and tell them the impact (broker reports, financial news) which take some time to write and distribute.
Getting the data
The EDGAR text data is easily accessible via the EDGAR website, however to process a large portion of it we will use the EDGAR api provided by the SEC. To narrow down our analysis focus we will analyse 10-Q reports only in this analysis.
We start with a list of stock tickers to analyse, we generated this list by looking at historical market caps of securities listed on the NASDAQ or NYSE less than $10bn and > $100m. You can get this information from yfinance or other data providers. If possible include delisted stocks with historical market cap to prevent against survivorship bias (EDGAR retains the report data for delisted companies).
A difficulty with the EDGAR database is that it uses CIK codes to identify companies, so we will need to map our stock tickers to CIK codes using the sec_cik_mapper package.
from sec_cik_mapper import StockMapper
mapper = StockMapper()

# Get mapping from ticker to CIK
cik_map = mapper.ticker_to_cik
Analysing the data
The quarterly reports must be submitted using the standard SEC format, which makes it easier for us to find and chop out the most important and sentiment yielding text.
We can download historical 10-Q reports for a single ticker using this python code (see source repo for all functions):
def analyse_ticker(ticker, form_type="10-Q", last_n=8):
    try:
        # get cik
        cik = cik_map[ticker]

        # then get recent 10q filings from EDGAR
        print(f"Getting filings for {ticker}")
        filings_df = get_filings(ticker, form_type=form_type, last_n=8)

        # for each filing get text and sentiment
        sentiment_data = []

        for index, row in filings_df.iterrows():
            accession_number = row["accessionNumber"]
            filing_inner_text = get_filing_text(cik, accession_number)
            if filing_inner_text is None:
                print(f"Unable to process text for filing {accession_number}")
                continue

            sentiment = get_finbert_sentiment(
                filing_inner_text[:5000]
            )  # We take the first 5000 characters to analyse

            d = row.to_dict()
            data = {
                "ticker": ticker,
                "cik": cik,
                "accessionNumber": accession_number,
                "timestamp": d["acceptanceDateTime"],
                "sentiment": sentiment,
                "summary": filing_inner_text[:250],
            }

            sentiment_data.append(data)
            if (
                sentiment > 0.25 or sentiment < -0.15
            ):  # we print out notable reports as we process
                print(f"{ticker} filing : {sentiment} : {filing_inner_text[:50]}")

        return sentiment_data
    except Exception as e:
        print(e)
        print(f"Failed to analyse ticker {ticker}")
We then send this text to our sentiment model which returns a value from -1 (most negative) to +1 (most positive). This sentiment model "finBERT" was trained on financial documents and is relatively good at understanding language in regards to a companies financials, although sometimes it can be misleading. The finbert in this repo is self hosted by 9epoch but the model is freely available on huggingface here: https://huggingface.co/ProsusAI/finbert
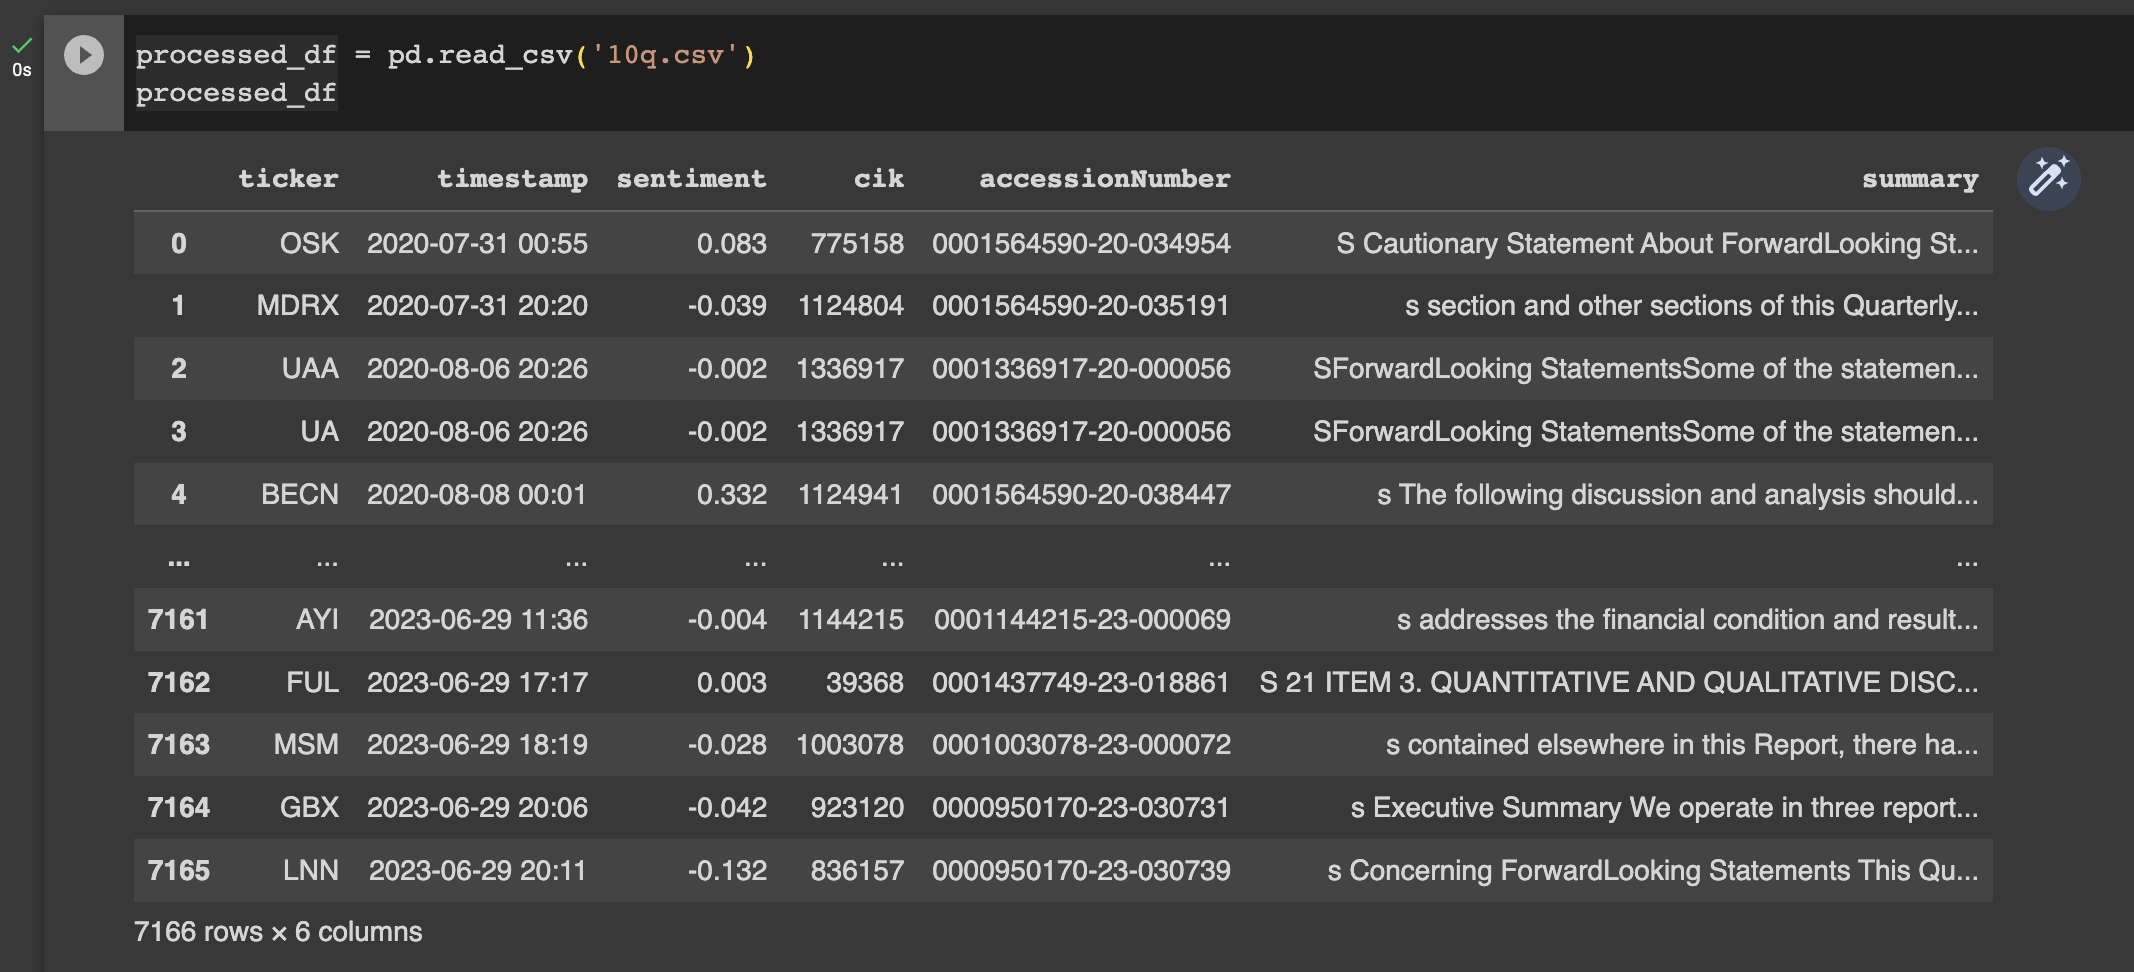
Once we have collected our 10-Q text and analysed its sentiment we have a csv like so:
We would like to understand a bit about the distribution of the sentiment factor, so we can set our long/short threshold. An easy approach is to do a sample of the distribution in the first couple of months of data and then exclude this "in sample" period from our analysis.
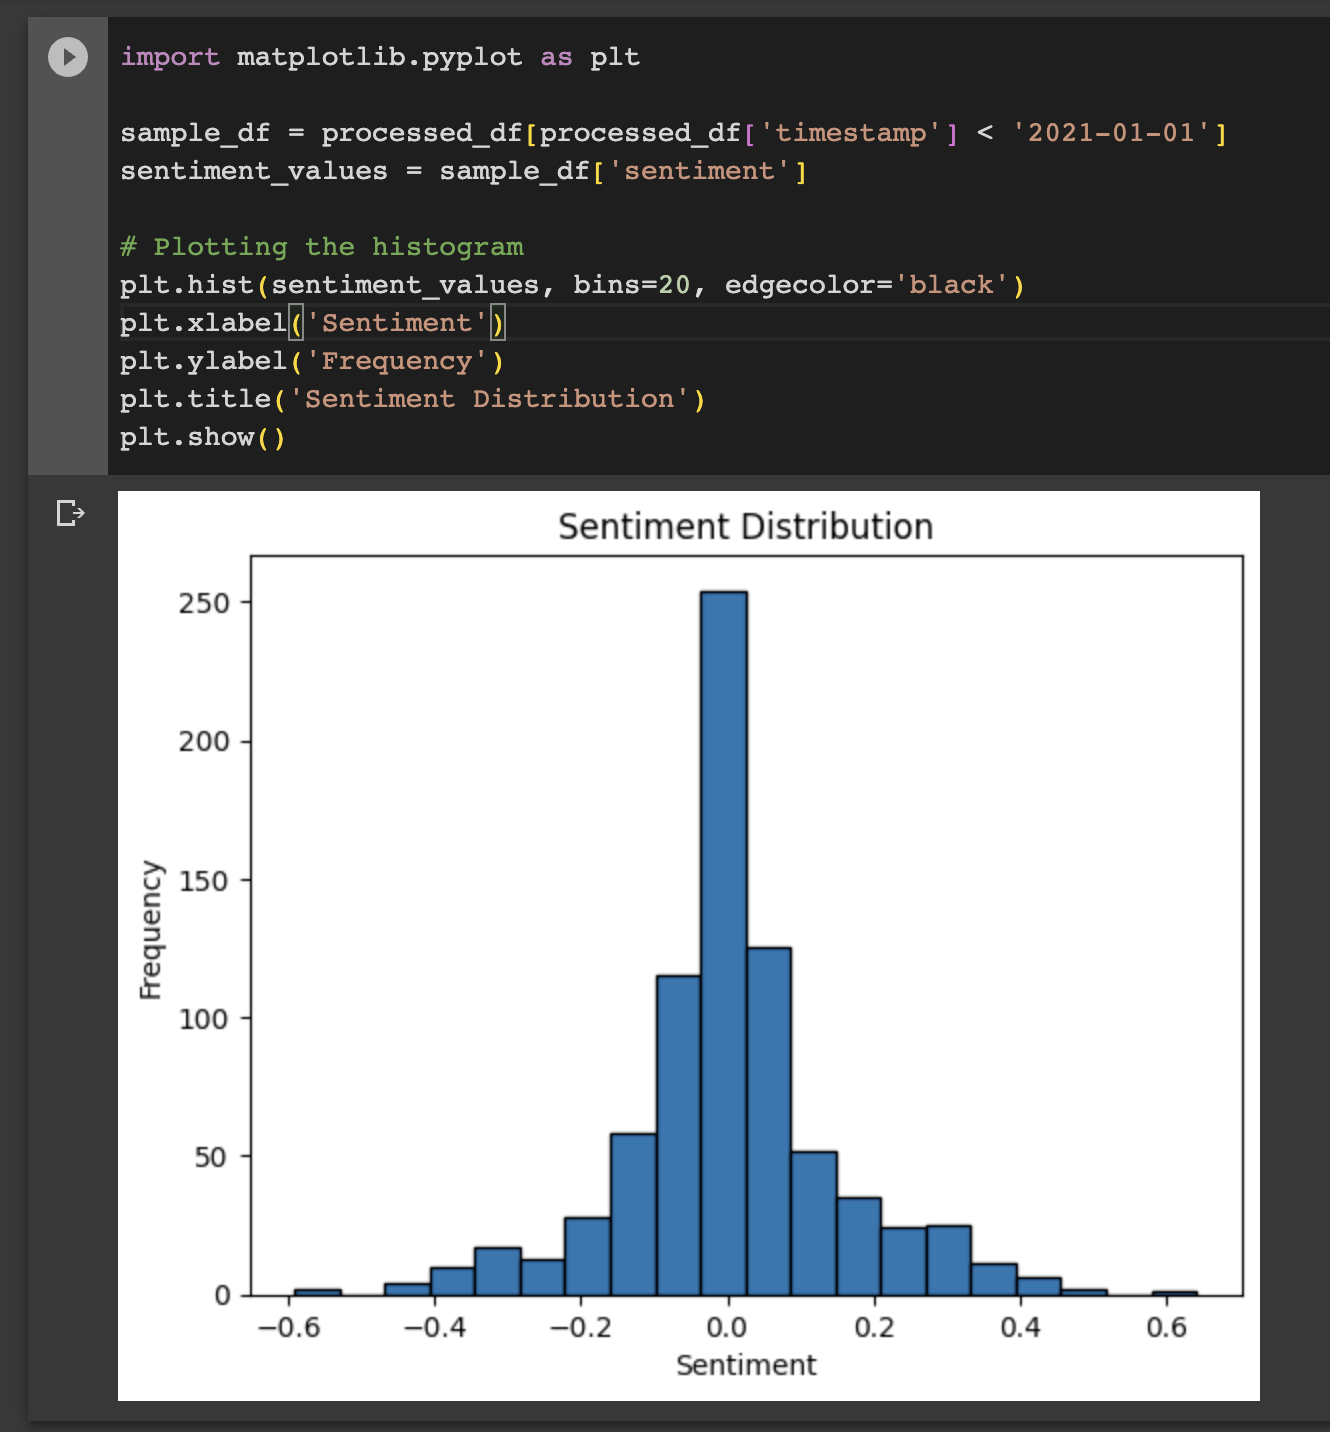
We can see from the distribution of sentiment scores across the 10-Q reports that it is roughly normal with very little skew and we will take that into account when splitting our alpha signals into longs & shorts. Care needs to be given with assumptions like this as there is the potential to future-leak an important parameter. If we went back in time we would not know the distribution of sentiment in advance but using 0 as the cut off for long/short direction is unlikely to be good as this will include a lot of mediocre news that should not be traded.
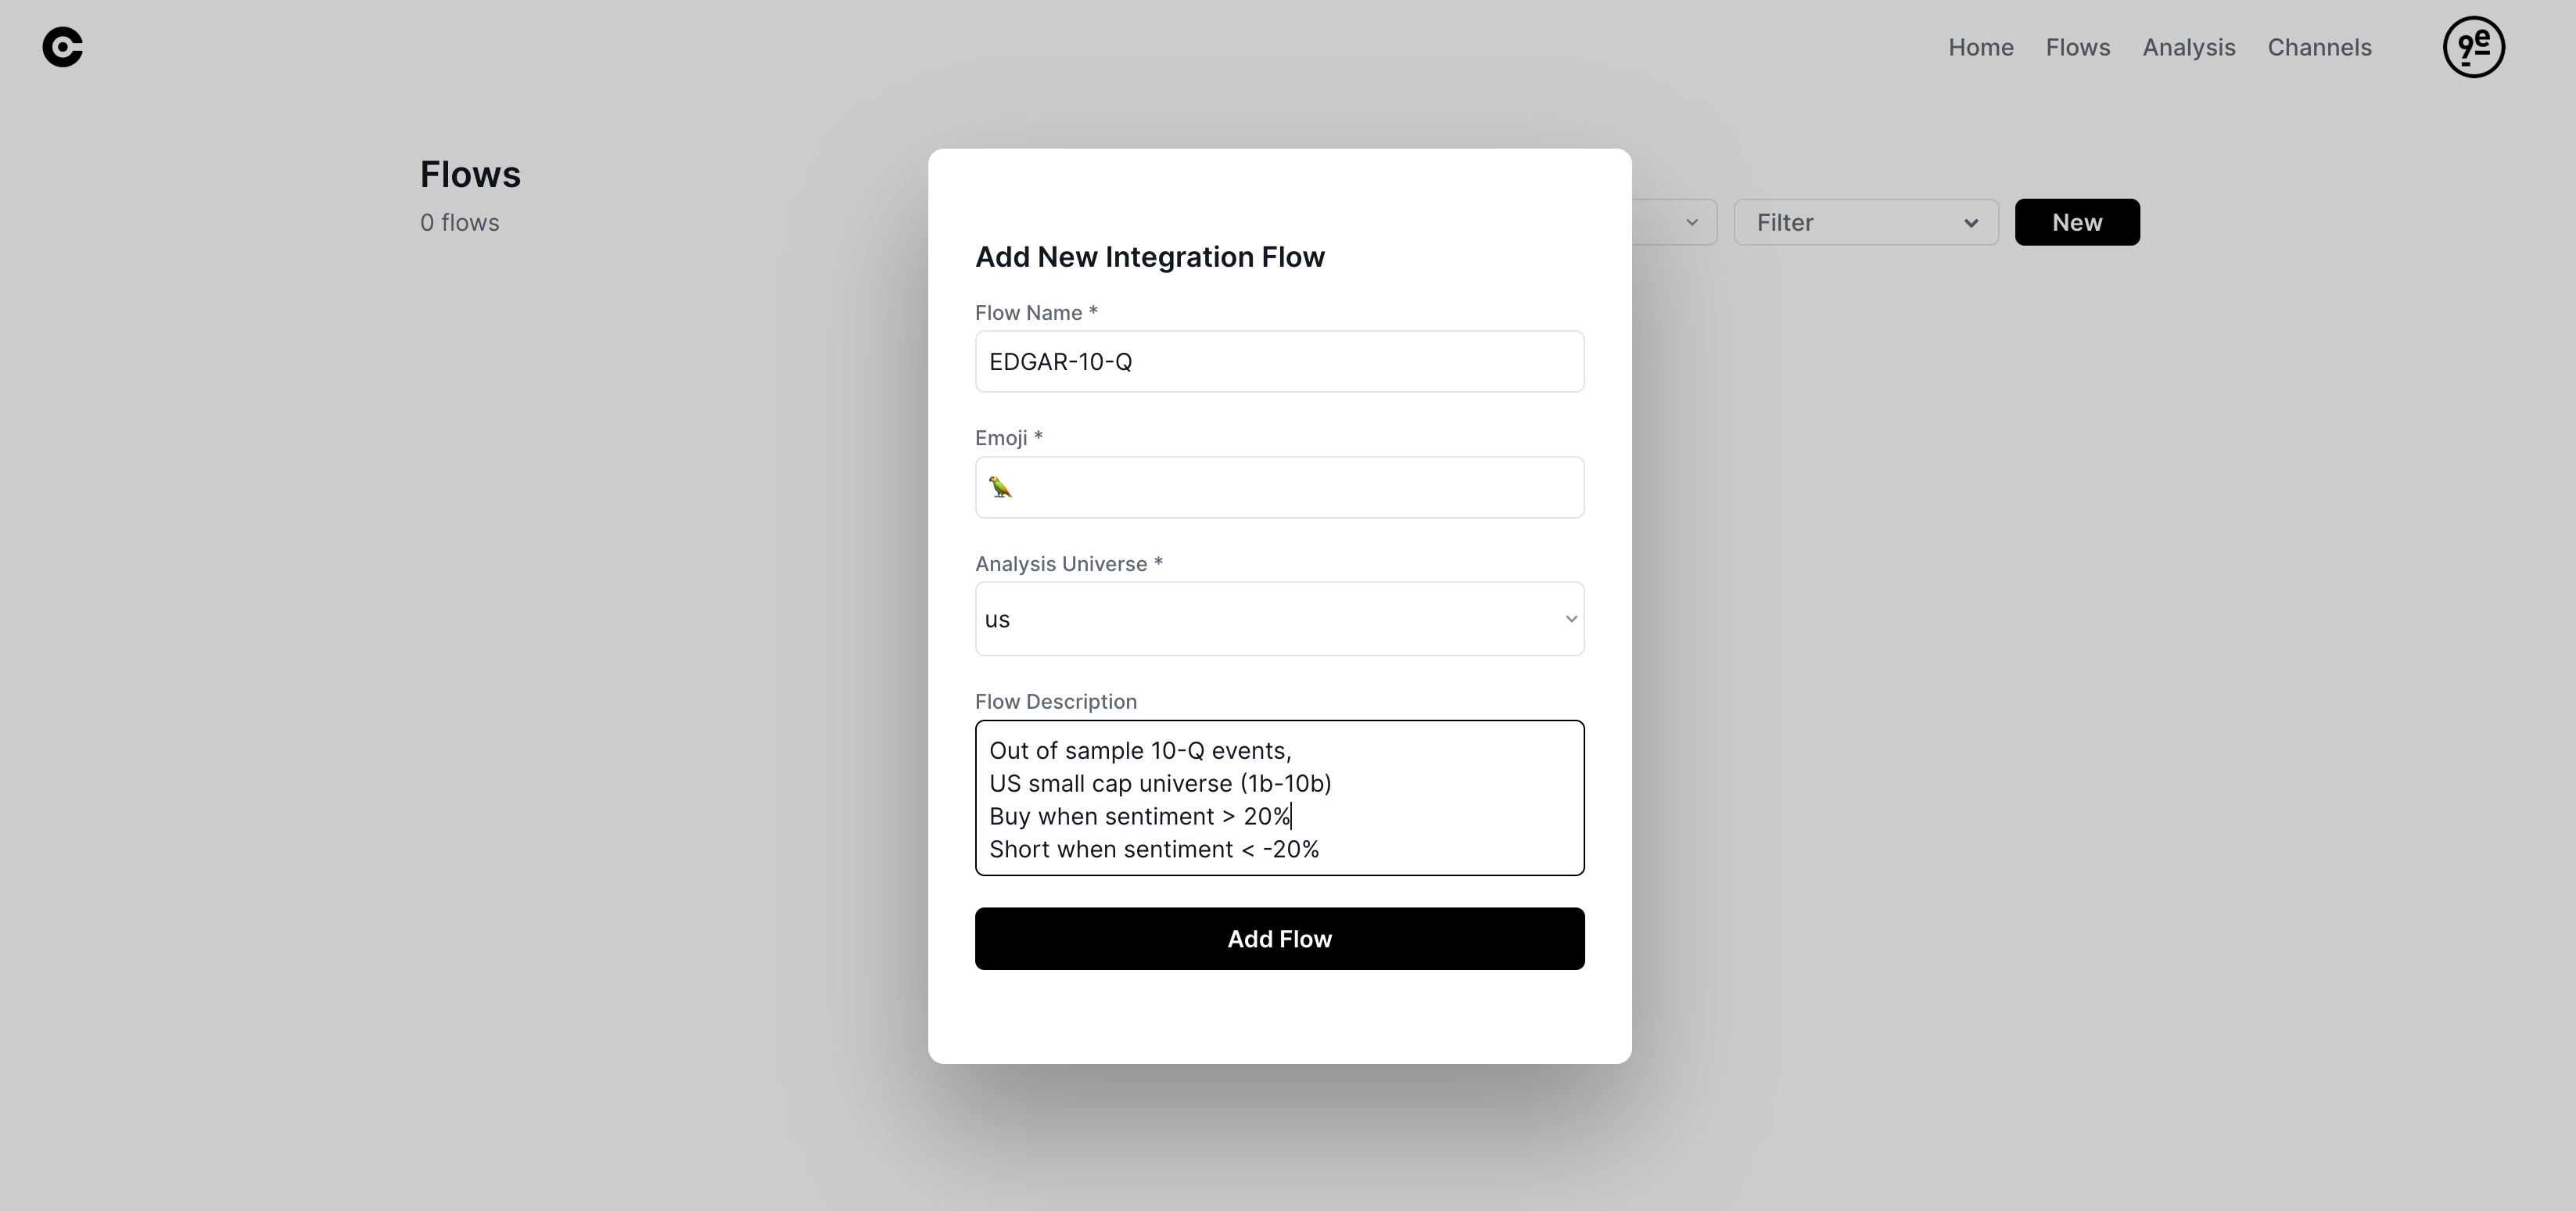
Creating a flow in Cyborg
Now that we have our quantitative feature (sentiment of small cap 10-Q reports) we simply send those events to Cyborg.
This is new research so we will create a new flow to contain all of the signals and analyse them as a group:
This gives us a webhook where we can send our signals using python, something like https://cyborg.9epoch.com/prod/integration_events... yours will be generated on demand.
We load the csv and define our buy and sell signals using sentiment thresholds to eliminate mediocre signals:
# send_to_cyborg.py

SHORT_MINIMUM_SENTIMENT = (
    -0.20
)  # we will go short when sentiment is lower than this number
LONG_MINIMUM_SENTIMENT = (
    0.20  # we will go long when sentiment is higher than this number
)

# get stored events from csv
events_df = pd.read_csv("10q_events.csv")

# convert datetime
events_df["timestamp"] = pd.to_datetime(events_df["timestamp"])

print(len(events_df))
And send to cyborg for analysis:
# send_to_cyborg.py

# remove sample
events_df = events_df[events_df["timestamp"] > "2021-01-01"]
events_list = events_df.to_dict(orient="records")

# send events to cyborg for market analysis
send_events_to_cyborg(
    events_list,
    long_minimum_sentiment=LONG_MINIMUM_SENTIMENT,
    short_minimum_sentiment=SHORT_MINIMUM_SENTIMENT,
)
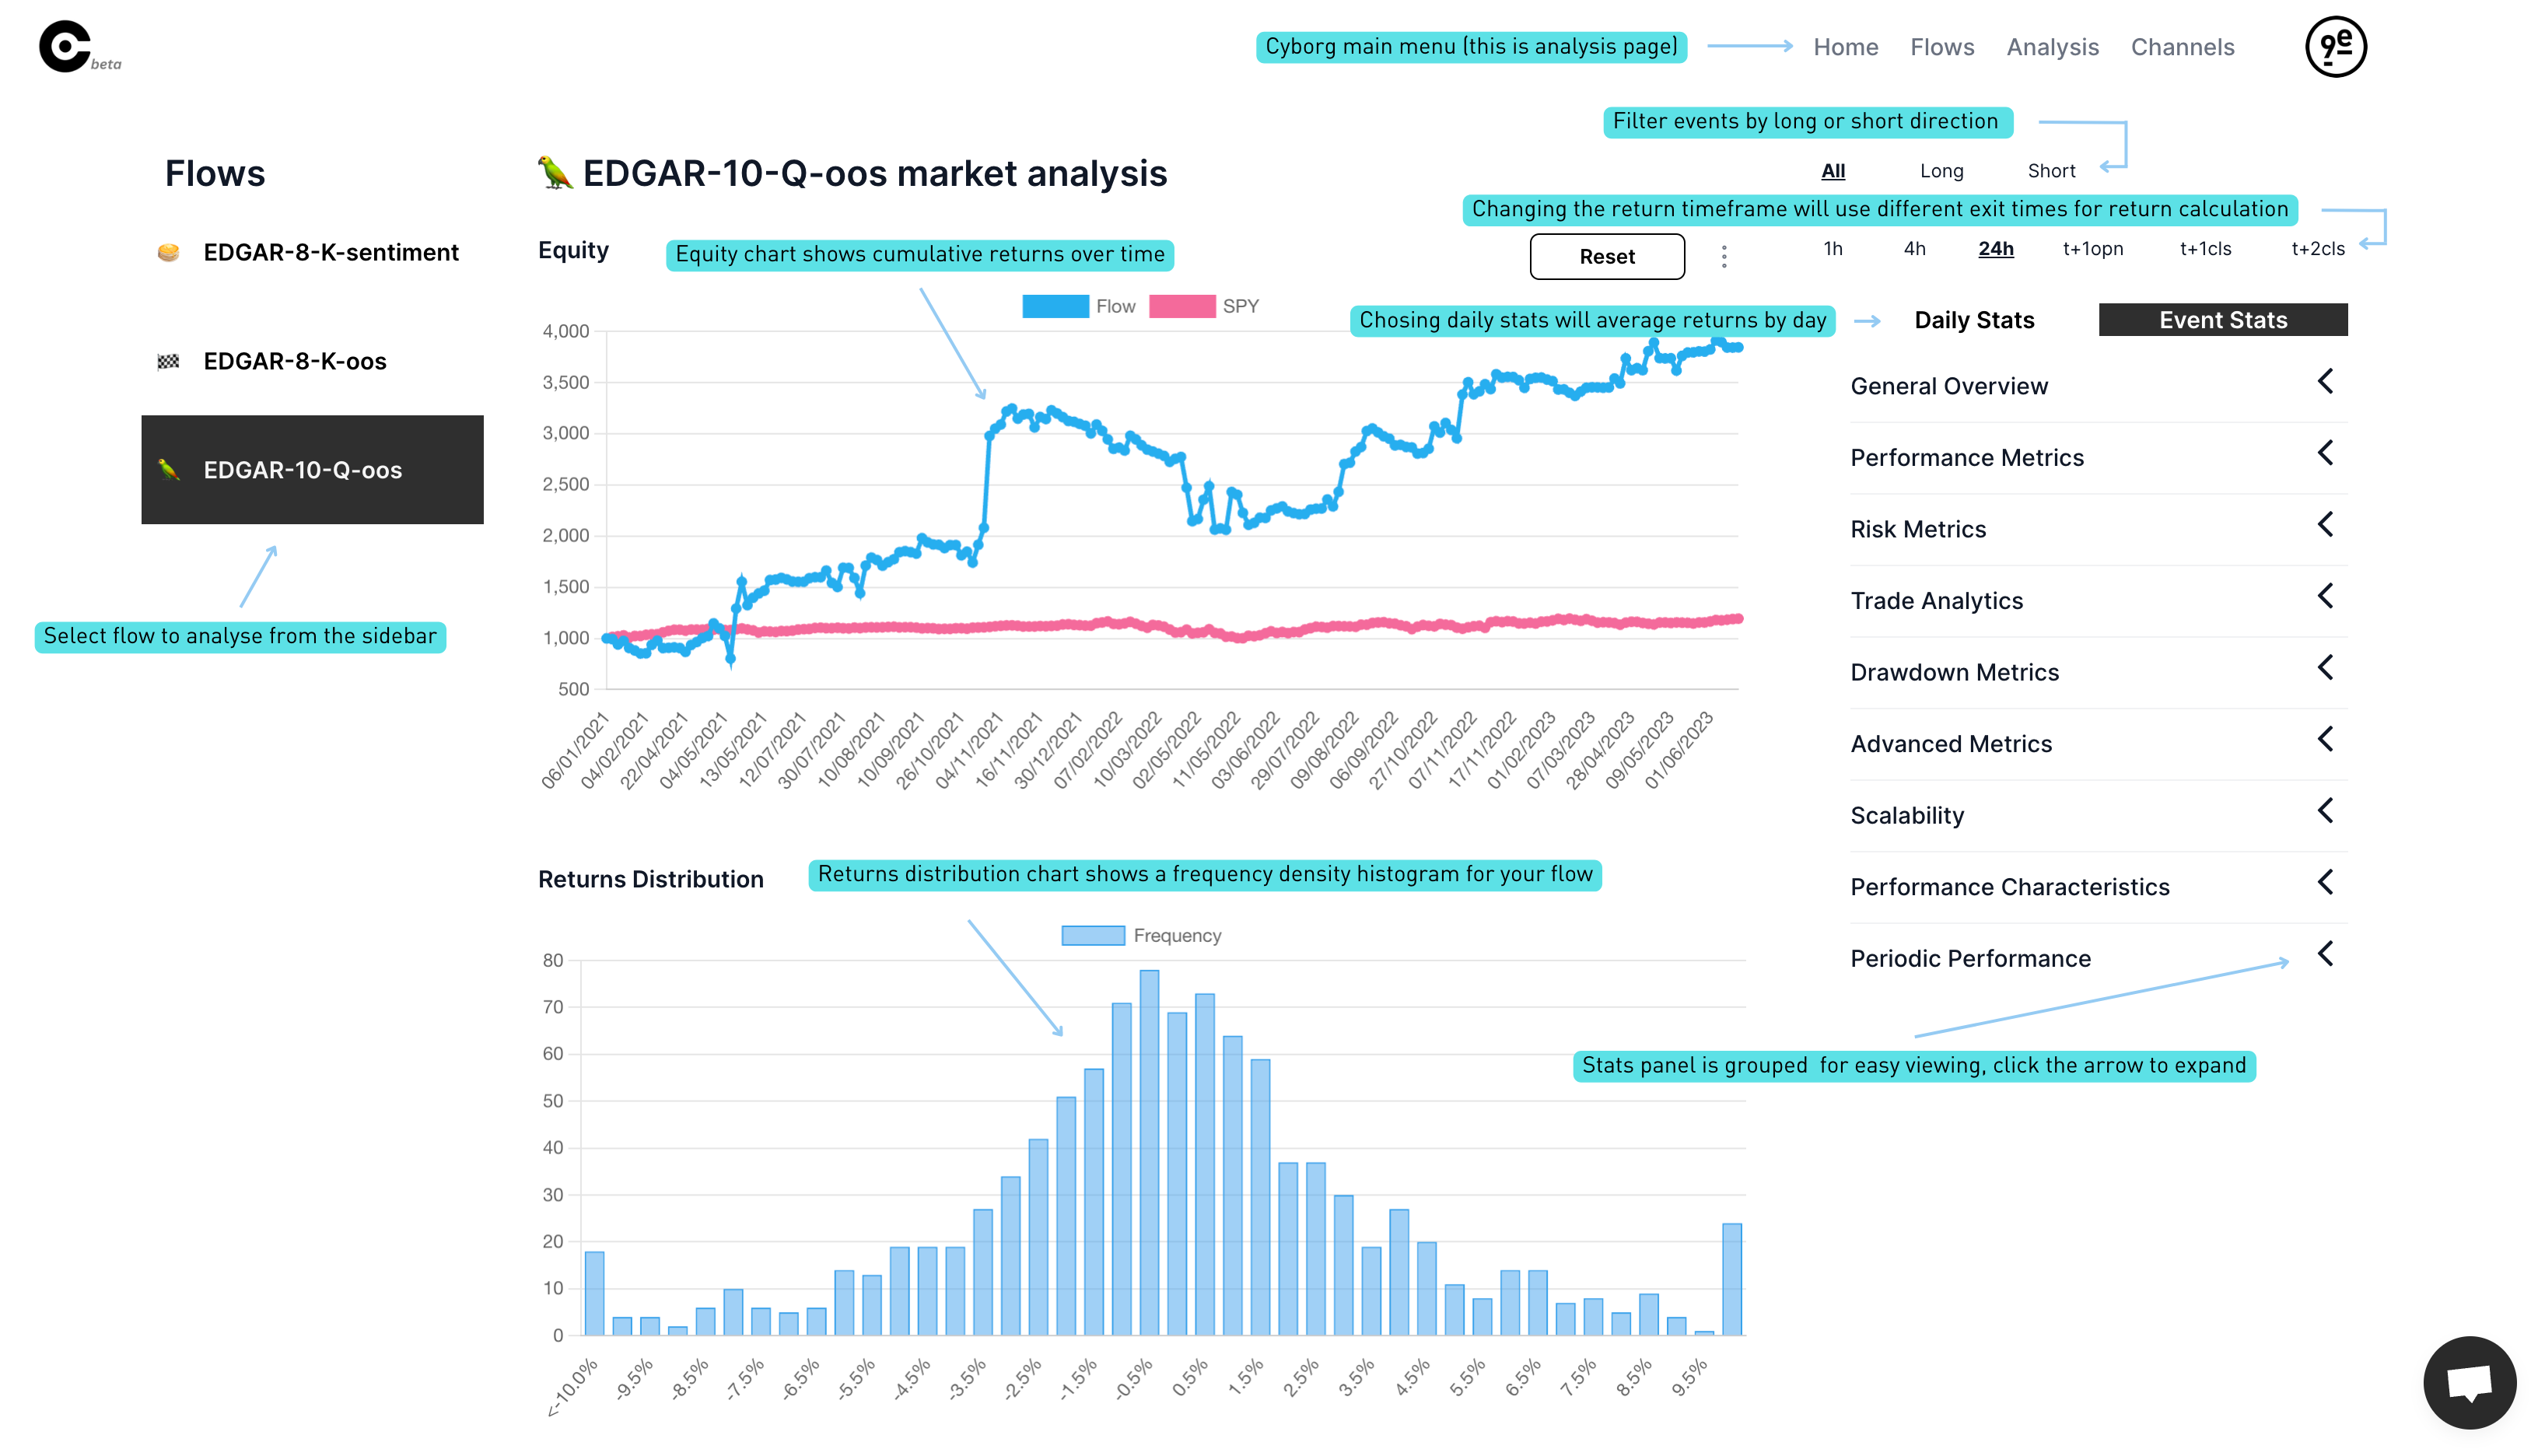
Examine the relationship with Cyborg
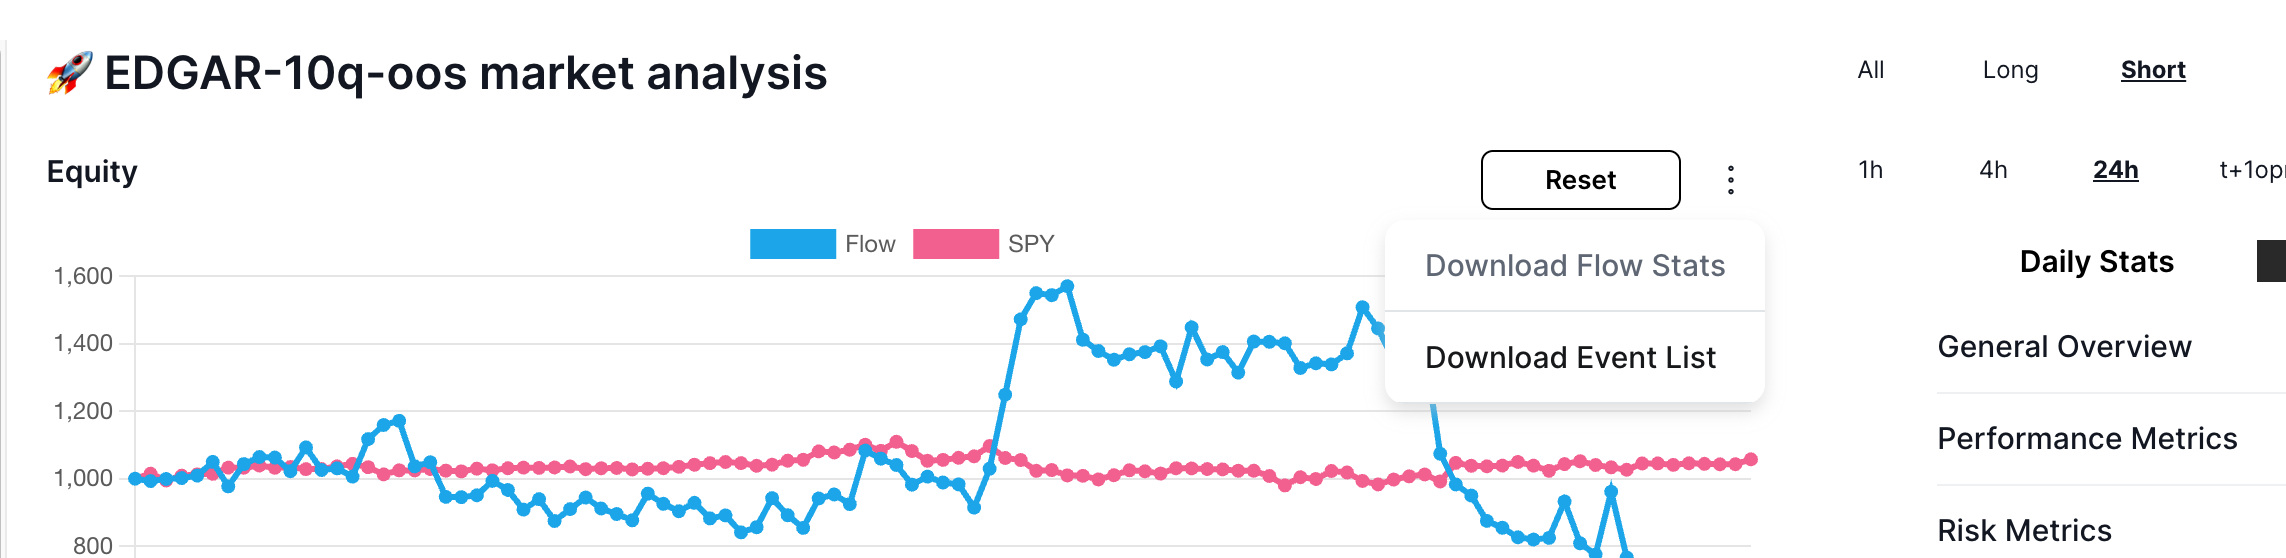
Those events will be analysed in realtime as they are received, so we wont have to wait long (~5mins) for our analysis page to populate:
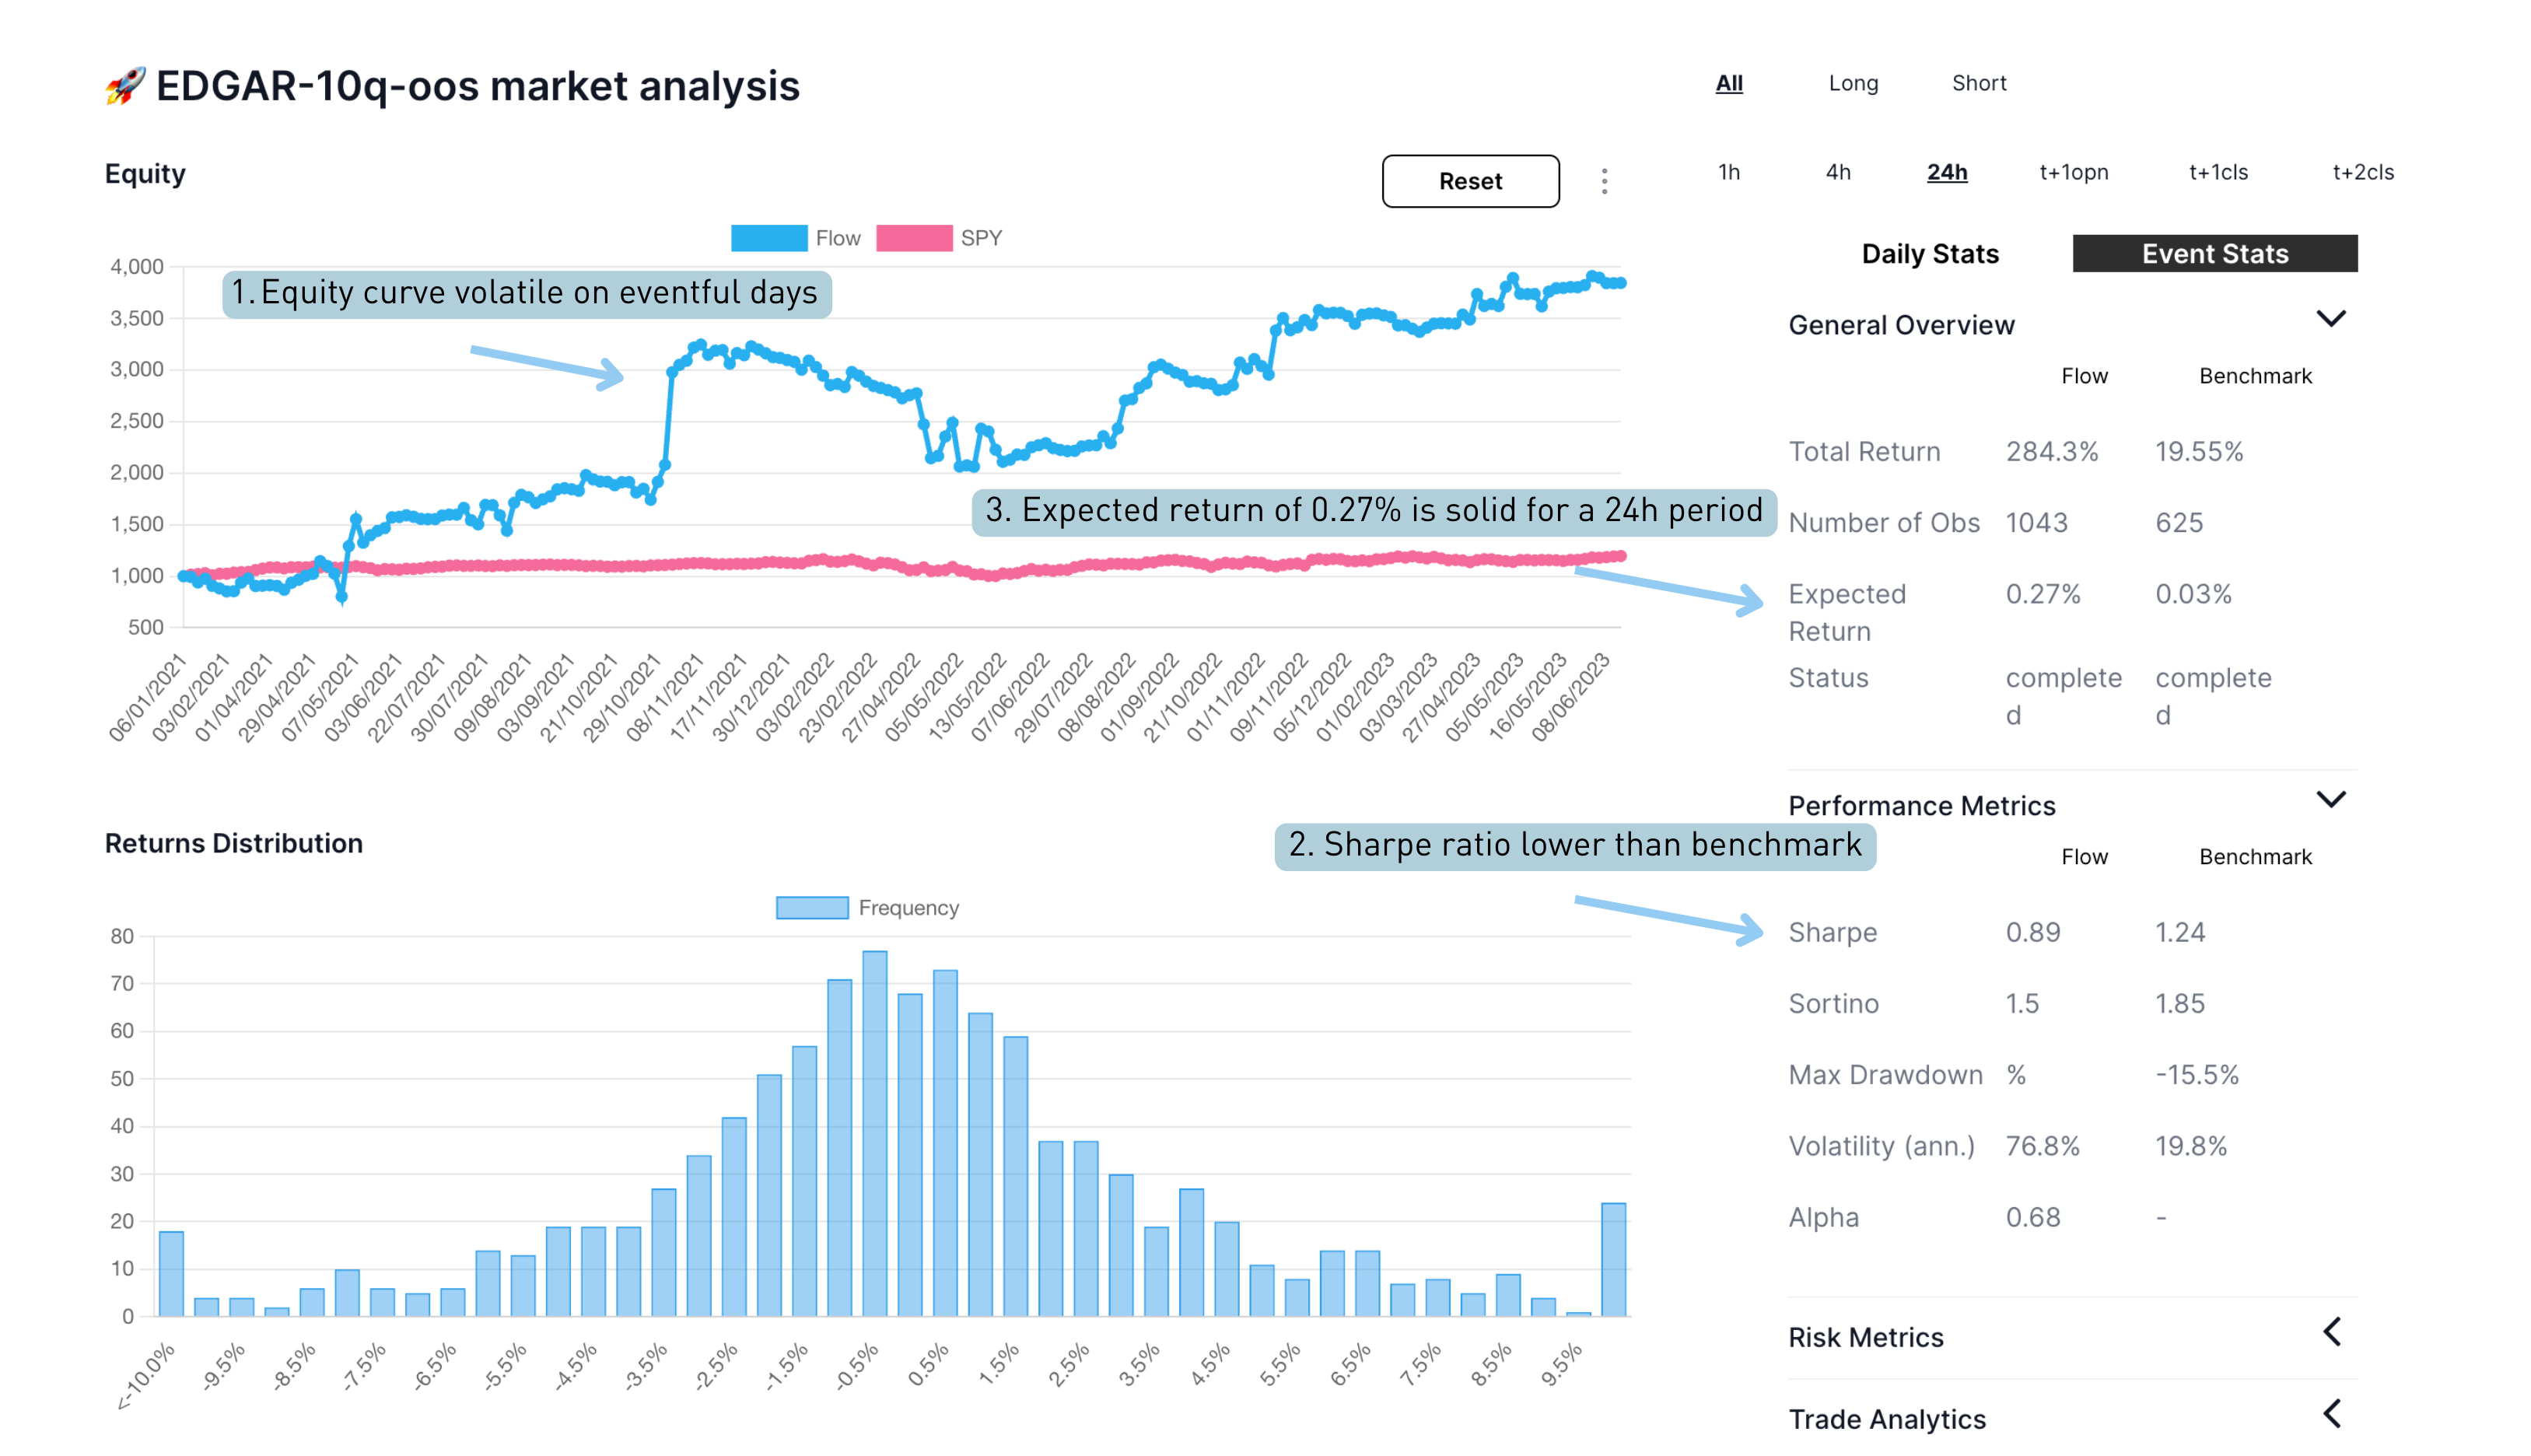
Looking through the calculated stats we can observe a few things:
- equity curve looks quite volatile, probably due to temporal clustering of tradable events due to quarterly release schedules
- sharpe ratio is less than the SPY benchmark
- expected return for the 24 hour period after the event is 27bps, which is promising
Using cyborg we can also view:
- different event study timeframes of 1hour to t+2 close
- daily average or event average returns (how to allocate capital to signals)
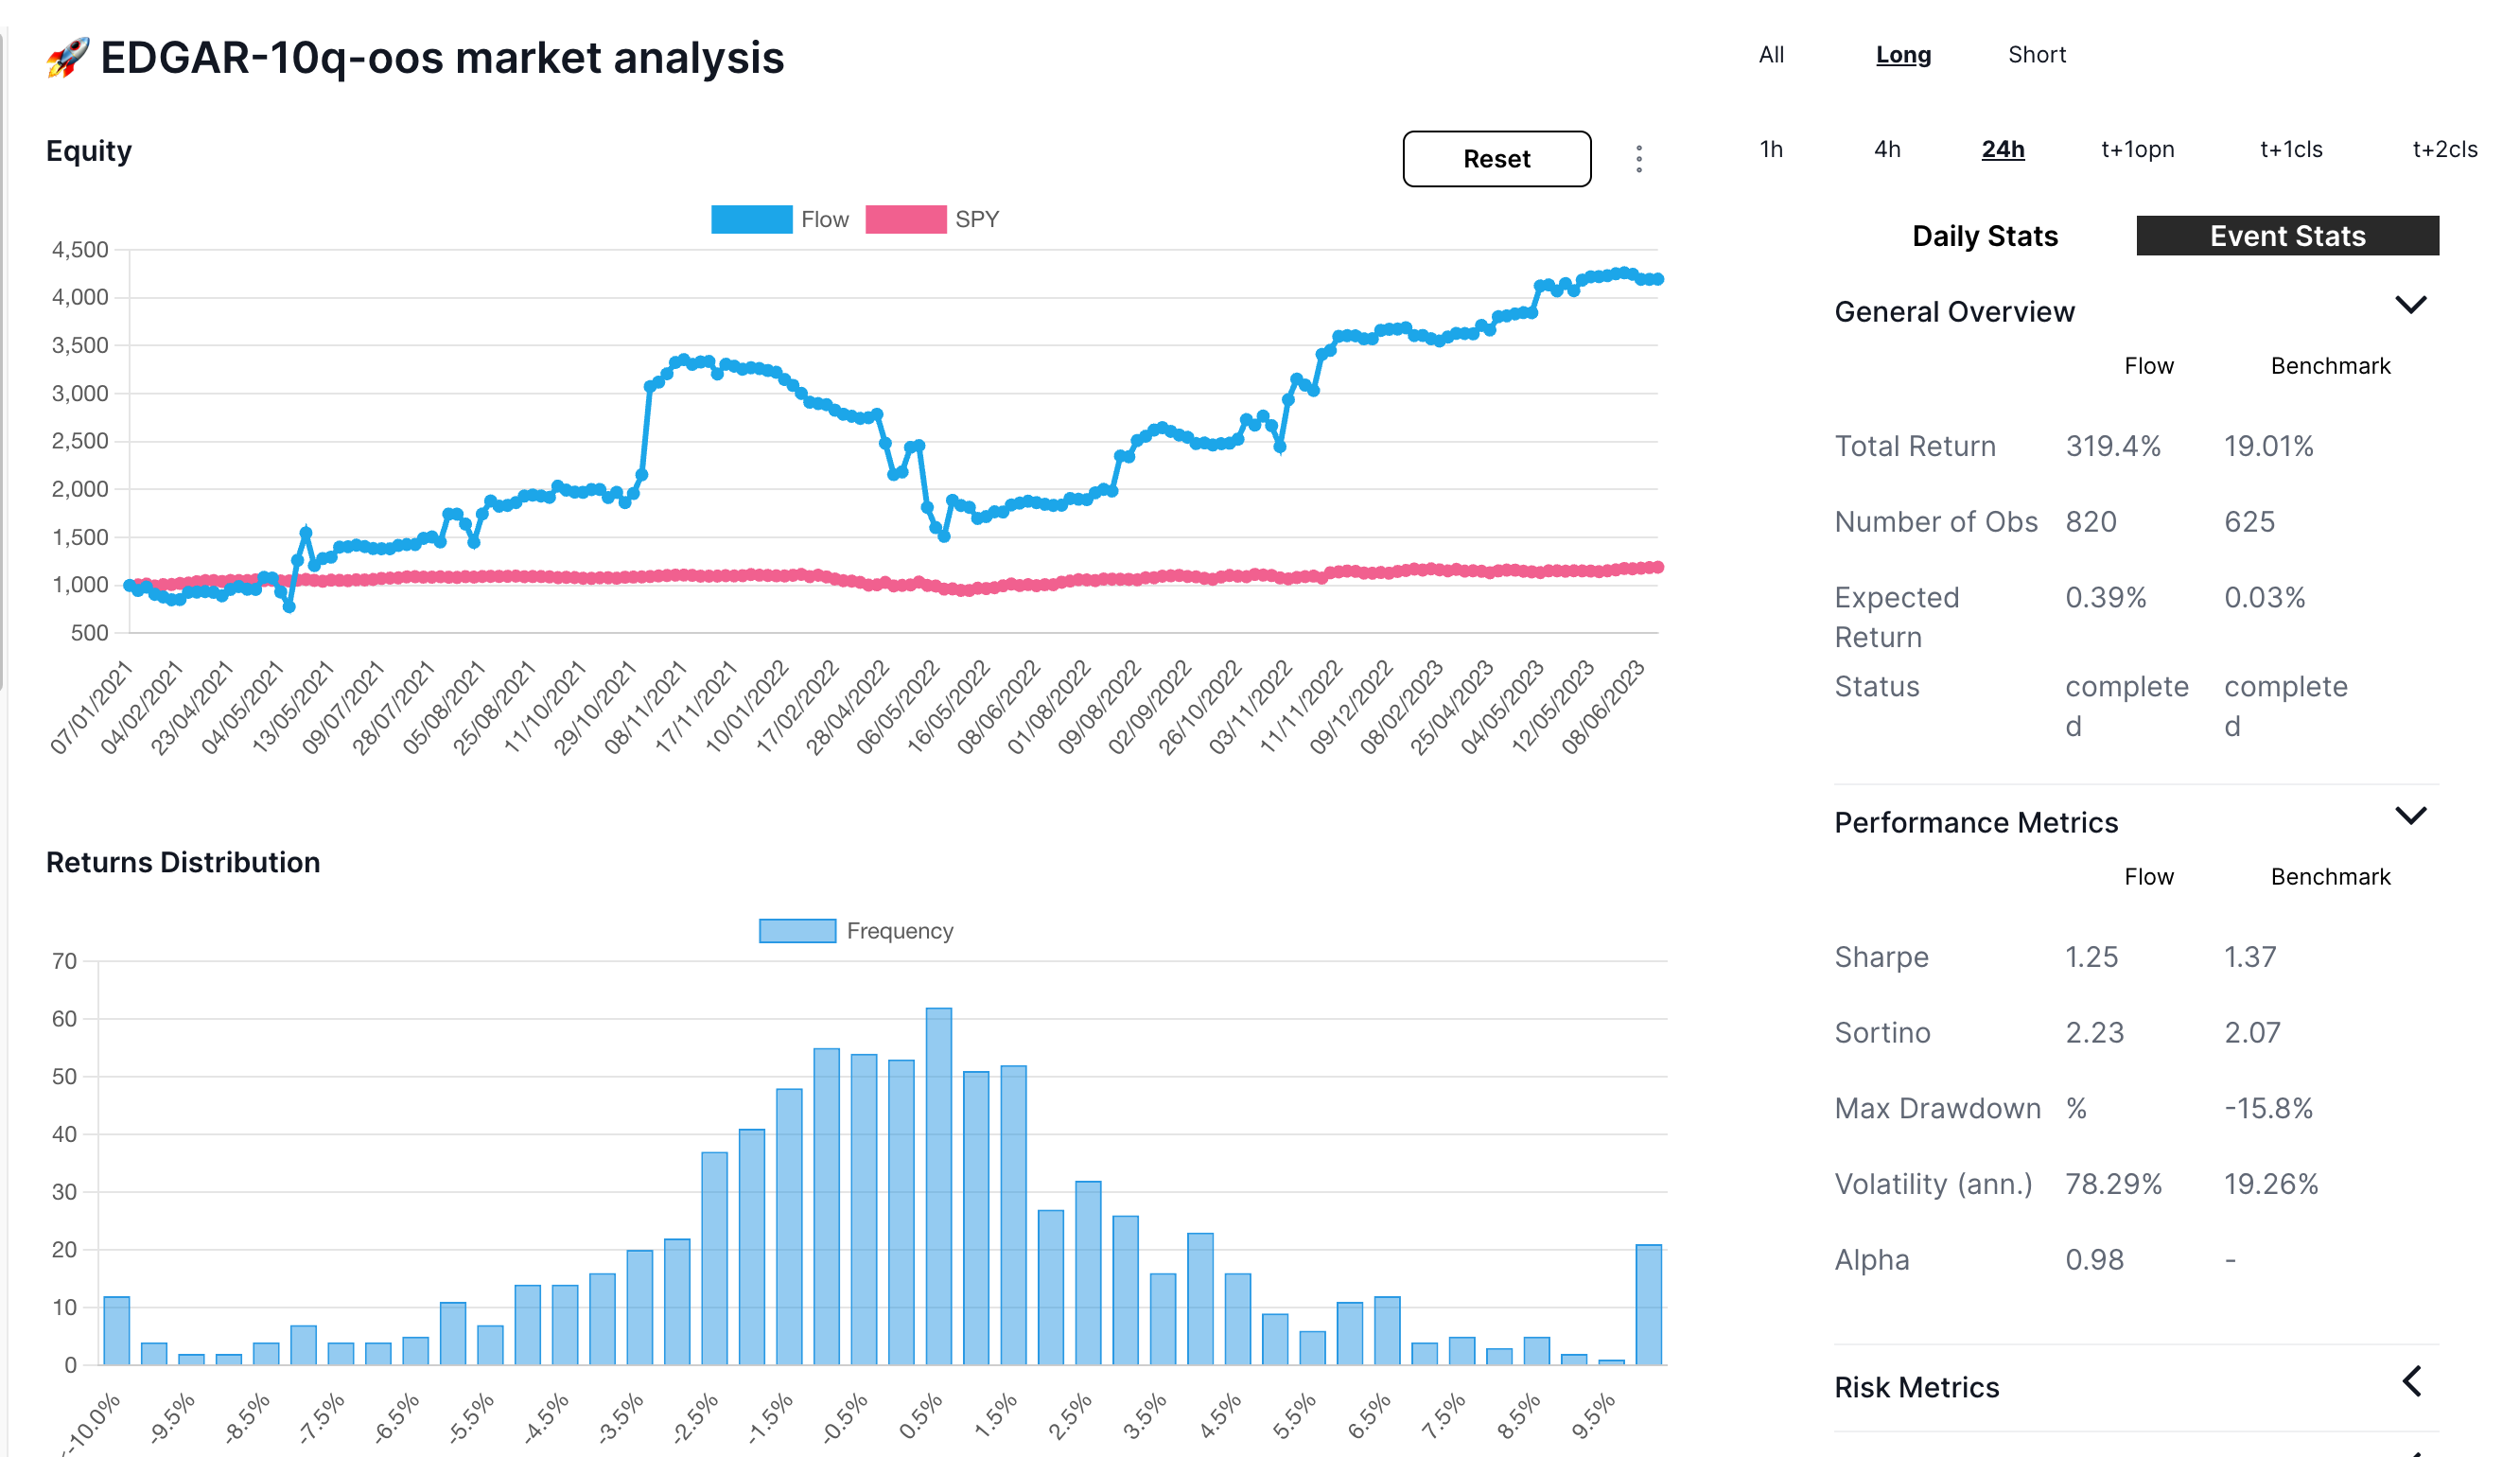
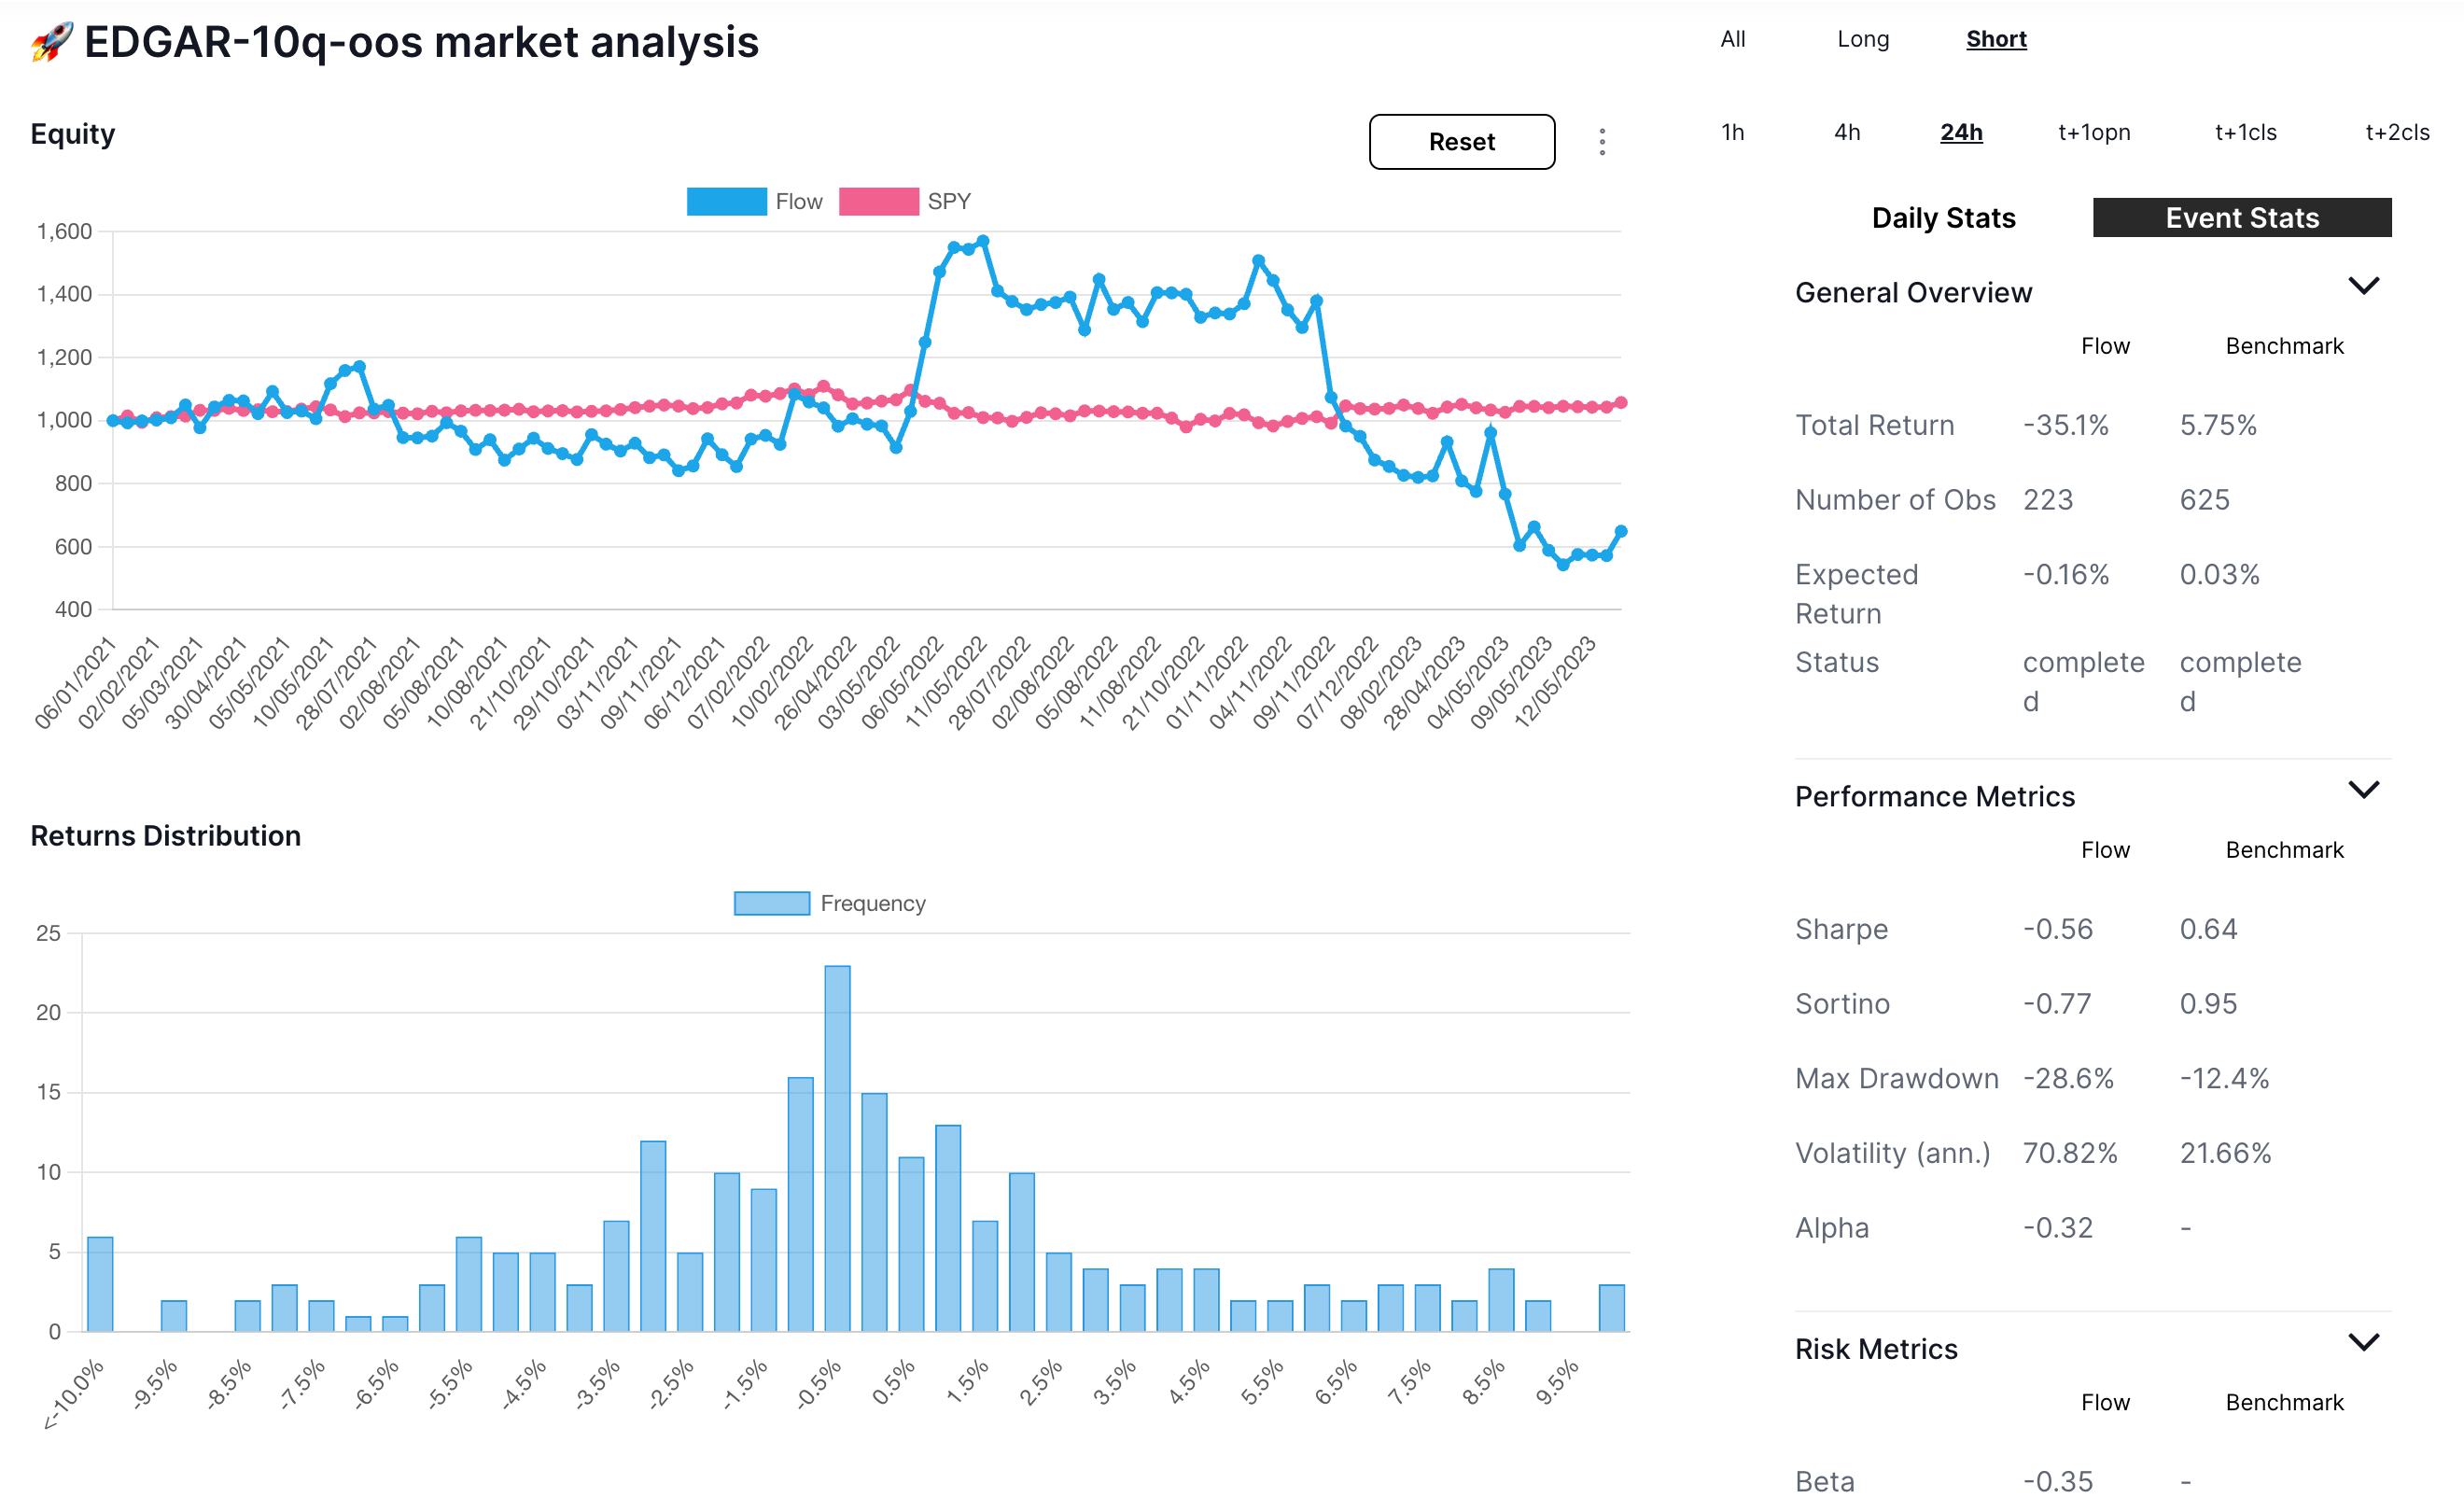
- long and short results independently (below)
Long-only looks somewhat better with an expected return of 39bps
Short-only did quite poorly, partially due to beta of -0.35
Cyborg calculates dozens of useful stats based on the events within a flow:
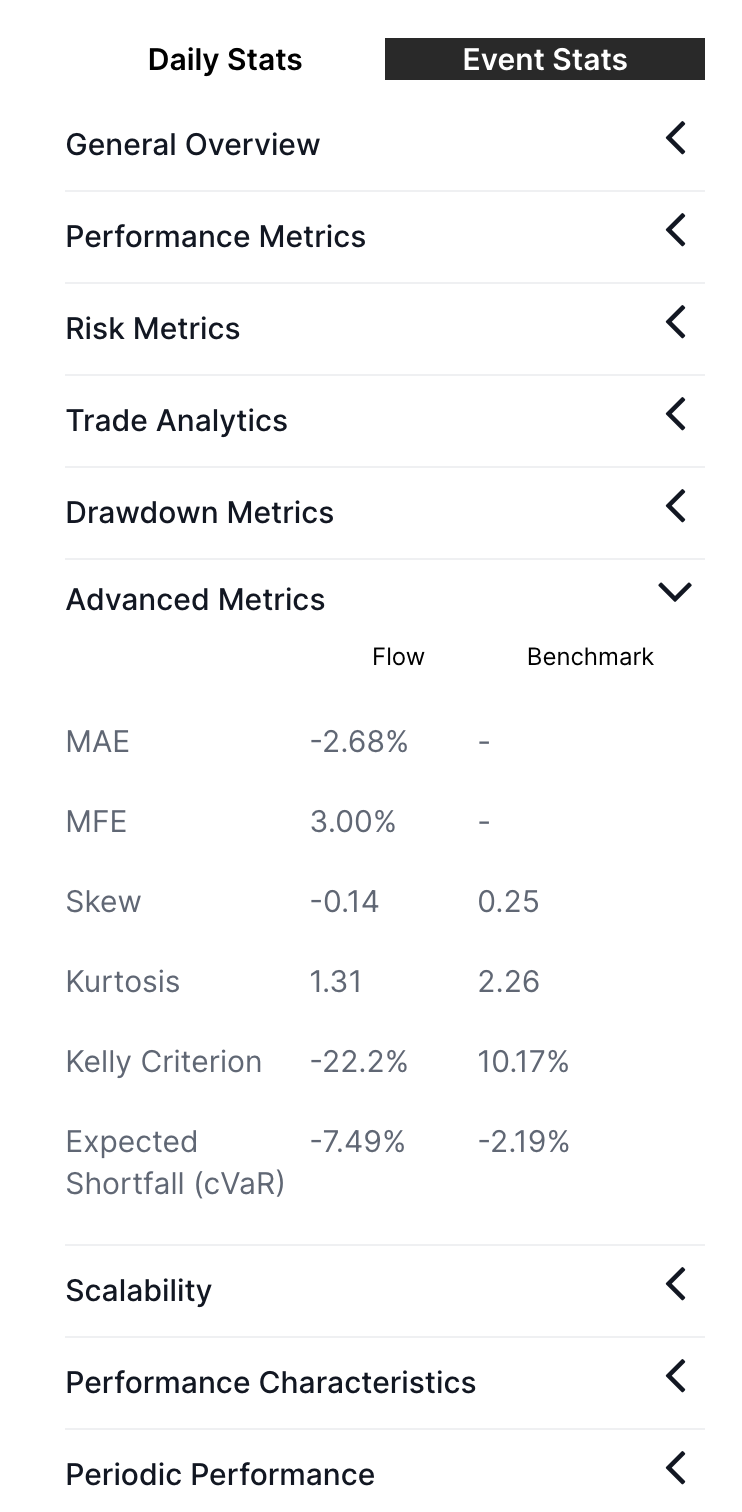
MAE and MFE for example stand for Maximum Adverse Excursion and Maximum Favourable Excursion and are particularly helpful in setting intelligent stop loss & take profits.
We are always working on new features, but for any custom analysis it is simple to download all the processed data using the "Download Event List" menu item:
Which yields a wide csv perfect for further research in excel, python or other tools:
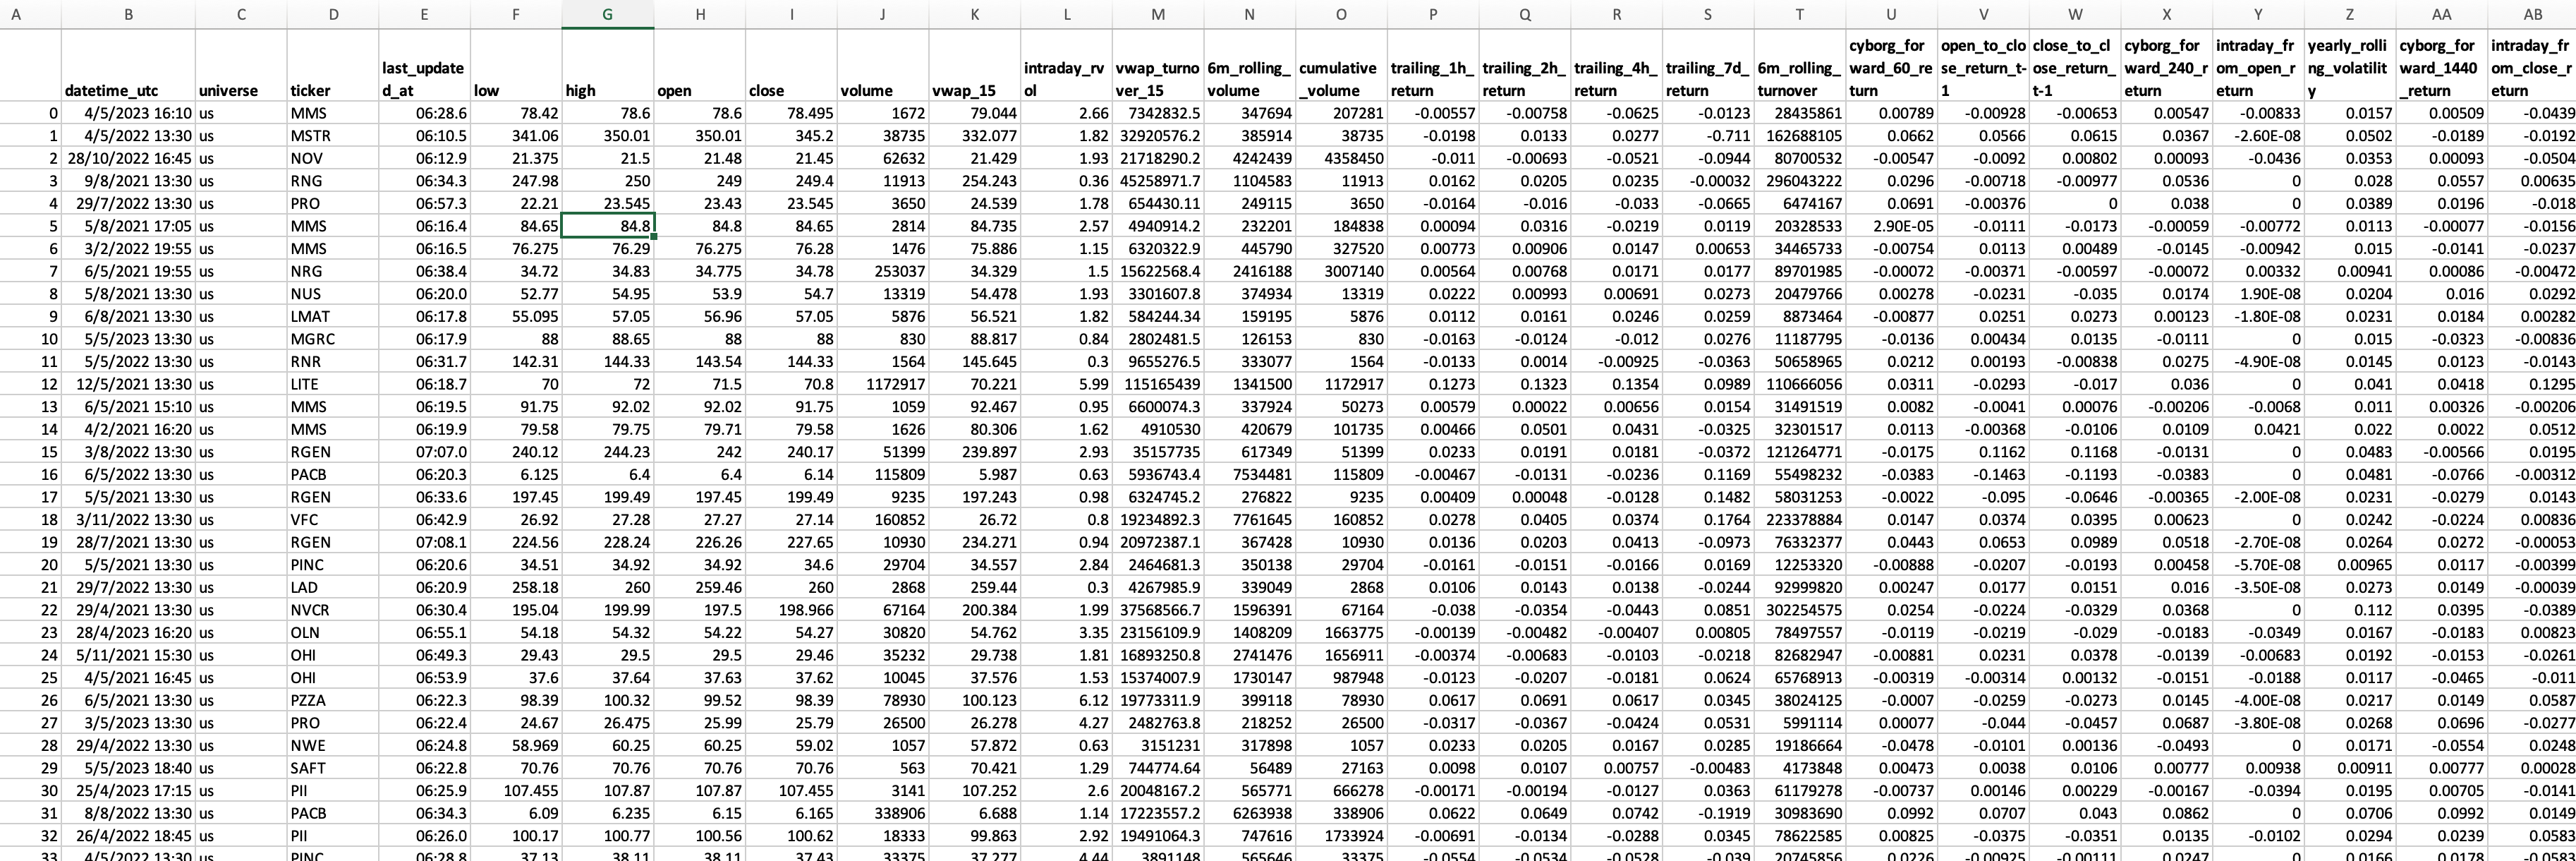
For example we can regress our sentiment against the 24 hour return:
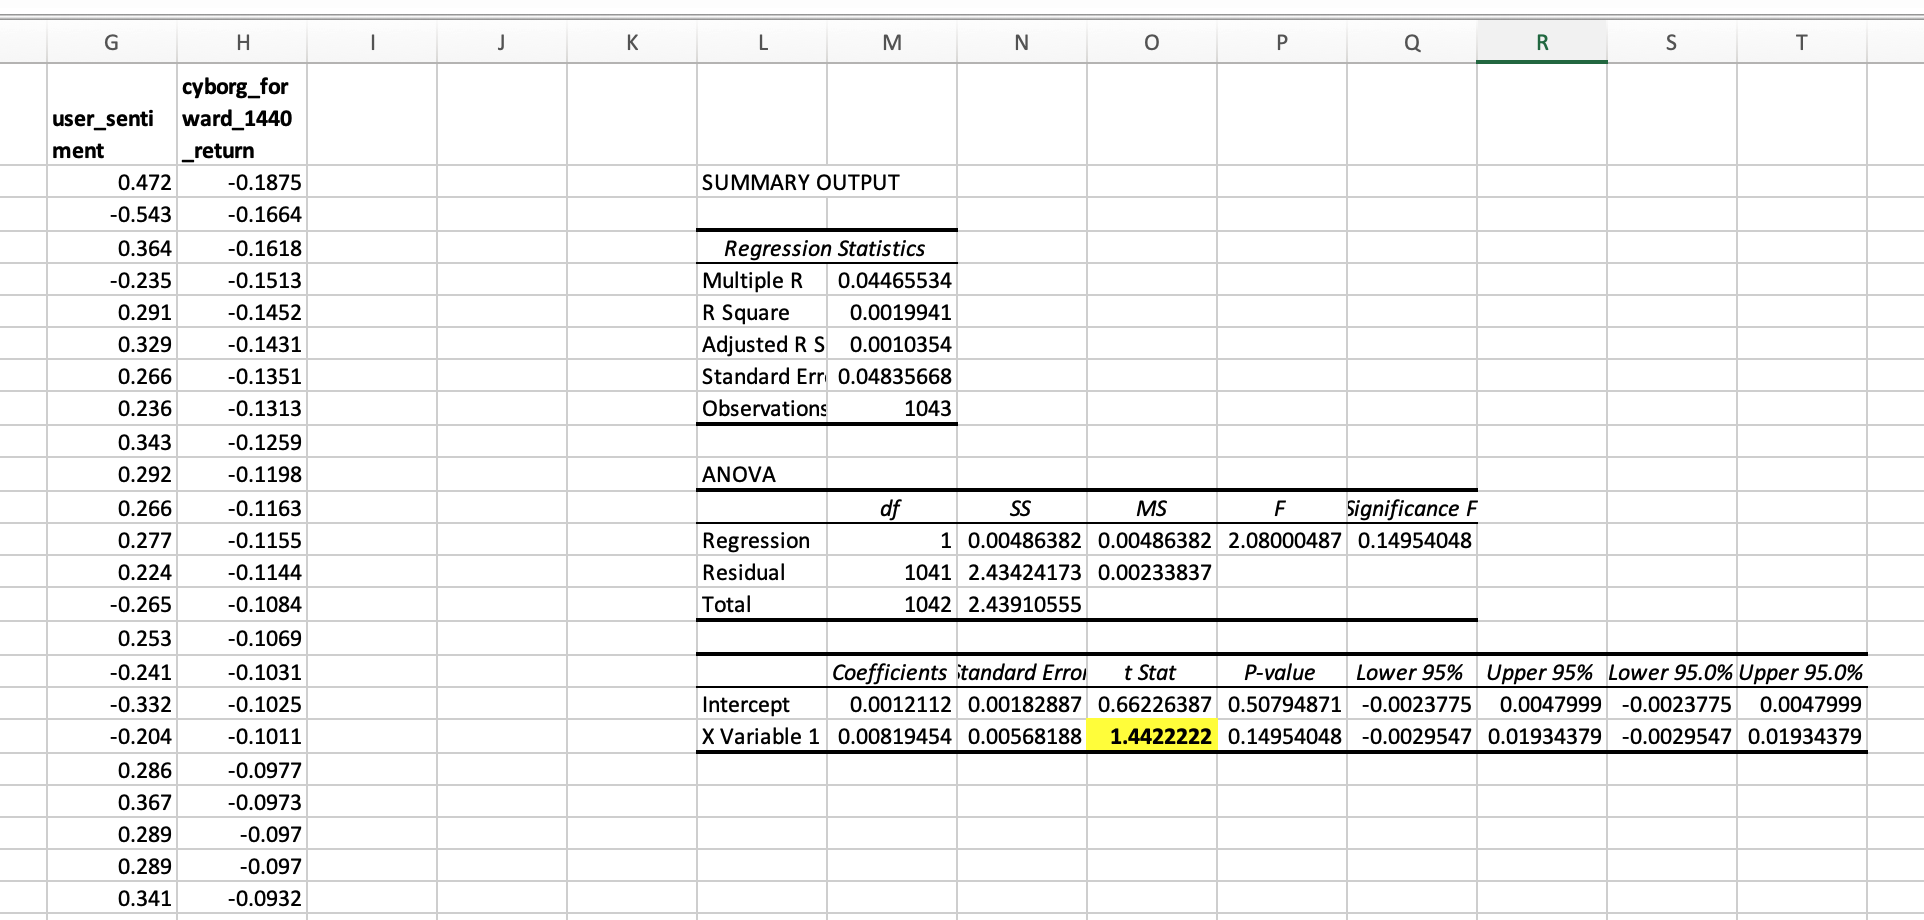
Which shows a tstat of 1.44, not enough to reject a null hypothesis, but an honest start for an alpha signal using free data in a liquid market.
To improve our alpha signals
To improve our signals we can:
- Examine why the negative sentiment 10-Q's did not lead to a share price drop
- Expand our analysis to other EDGAR forms perhaps more amenable to sentiment analysis
- Try adding more factors to our model for example price momentum can often be a great filter for news based strategies
- Watch the signals come through in real time so we can get a better understanding of the market dynamics
- Refine and retrain our sentiment model to better understand this specific domain
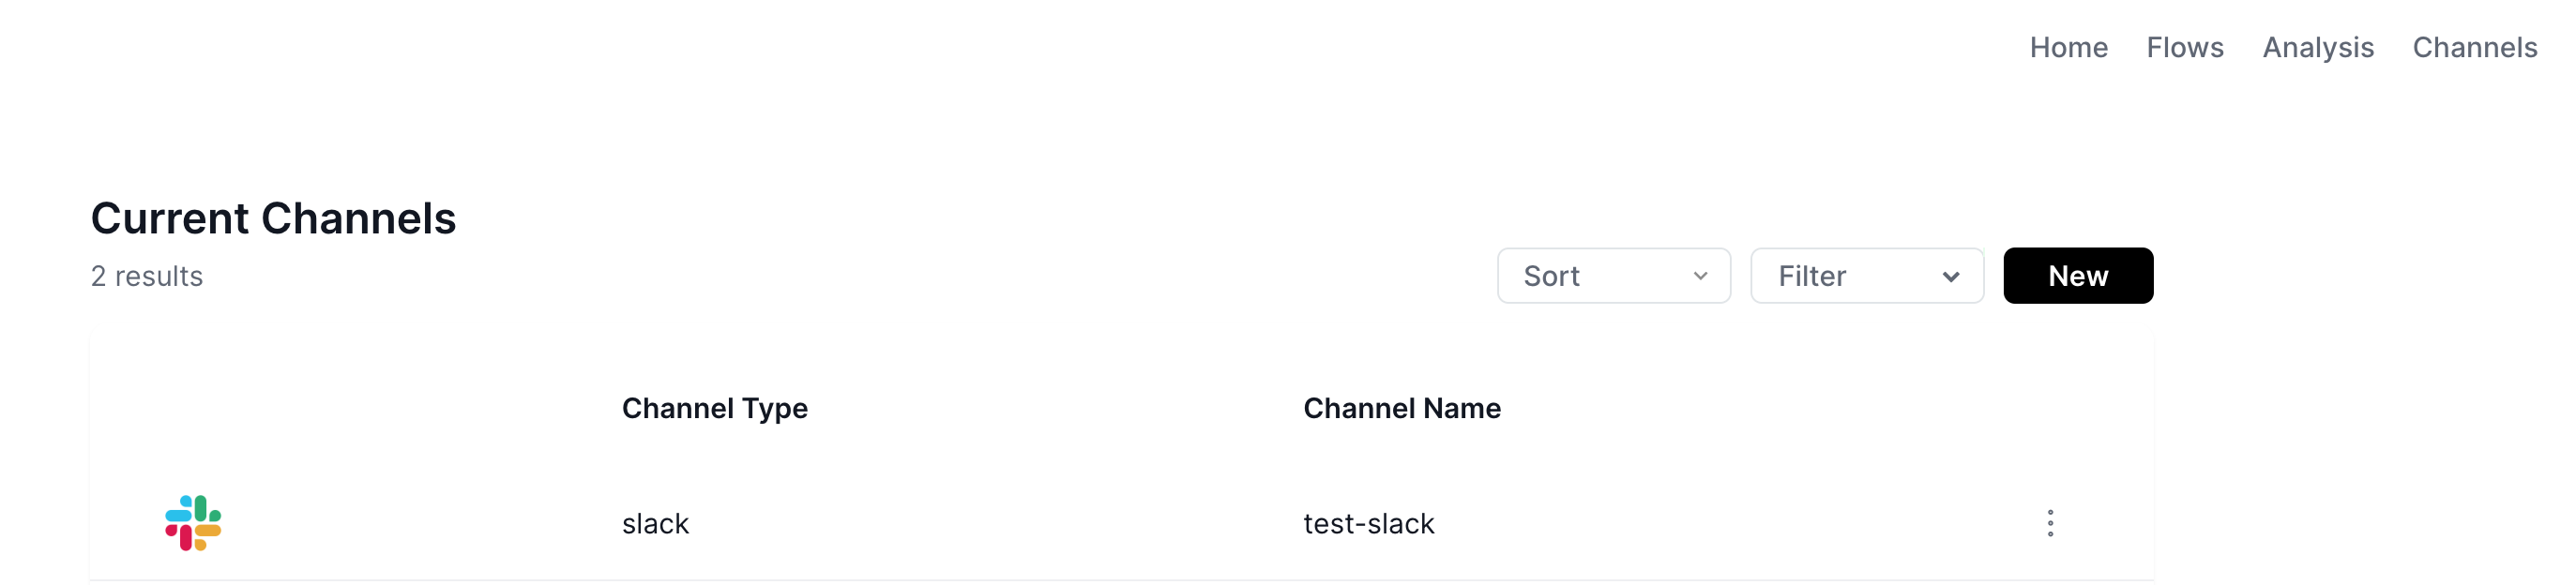
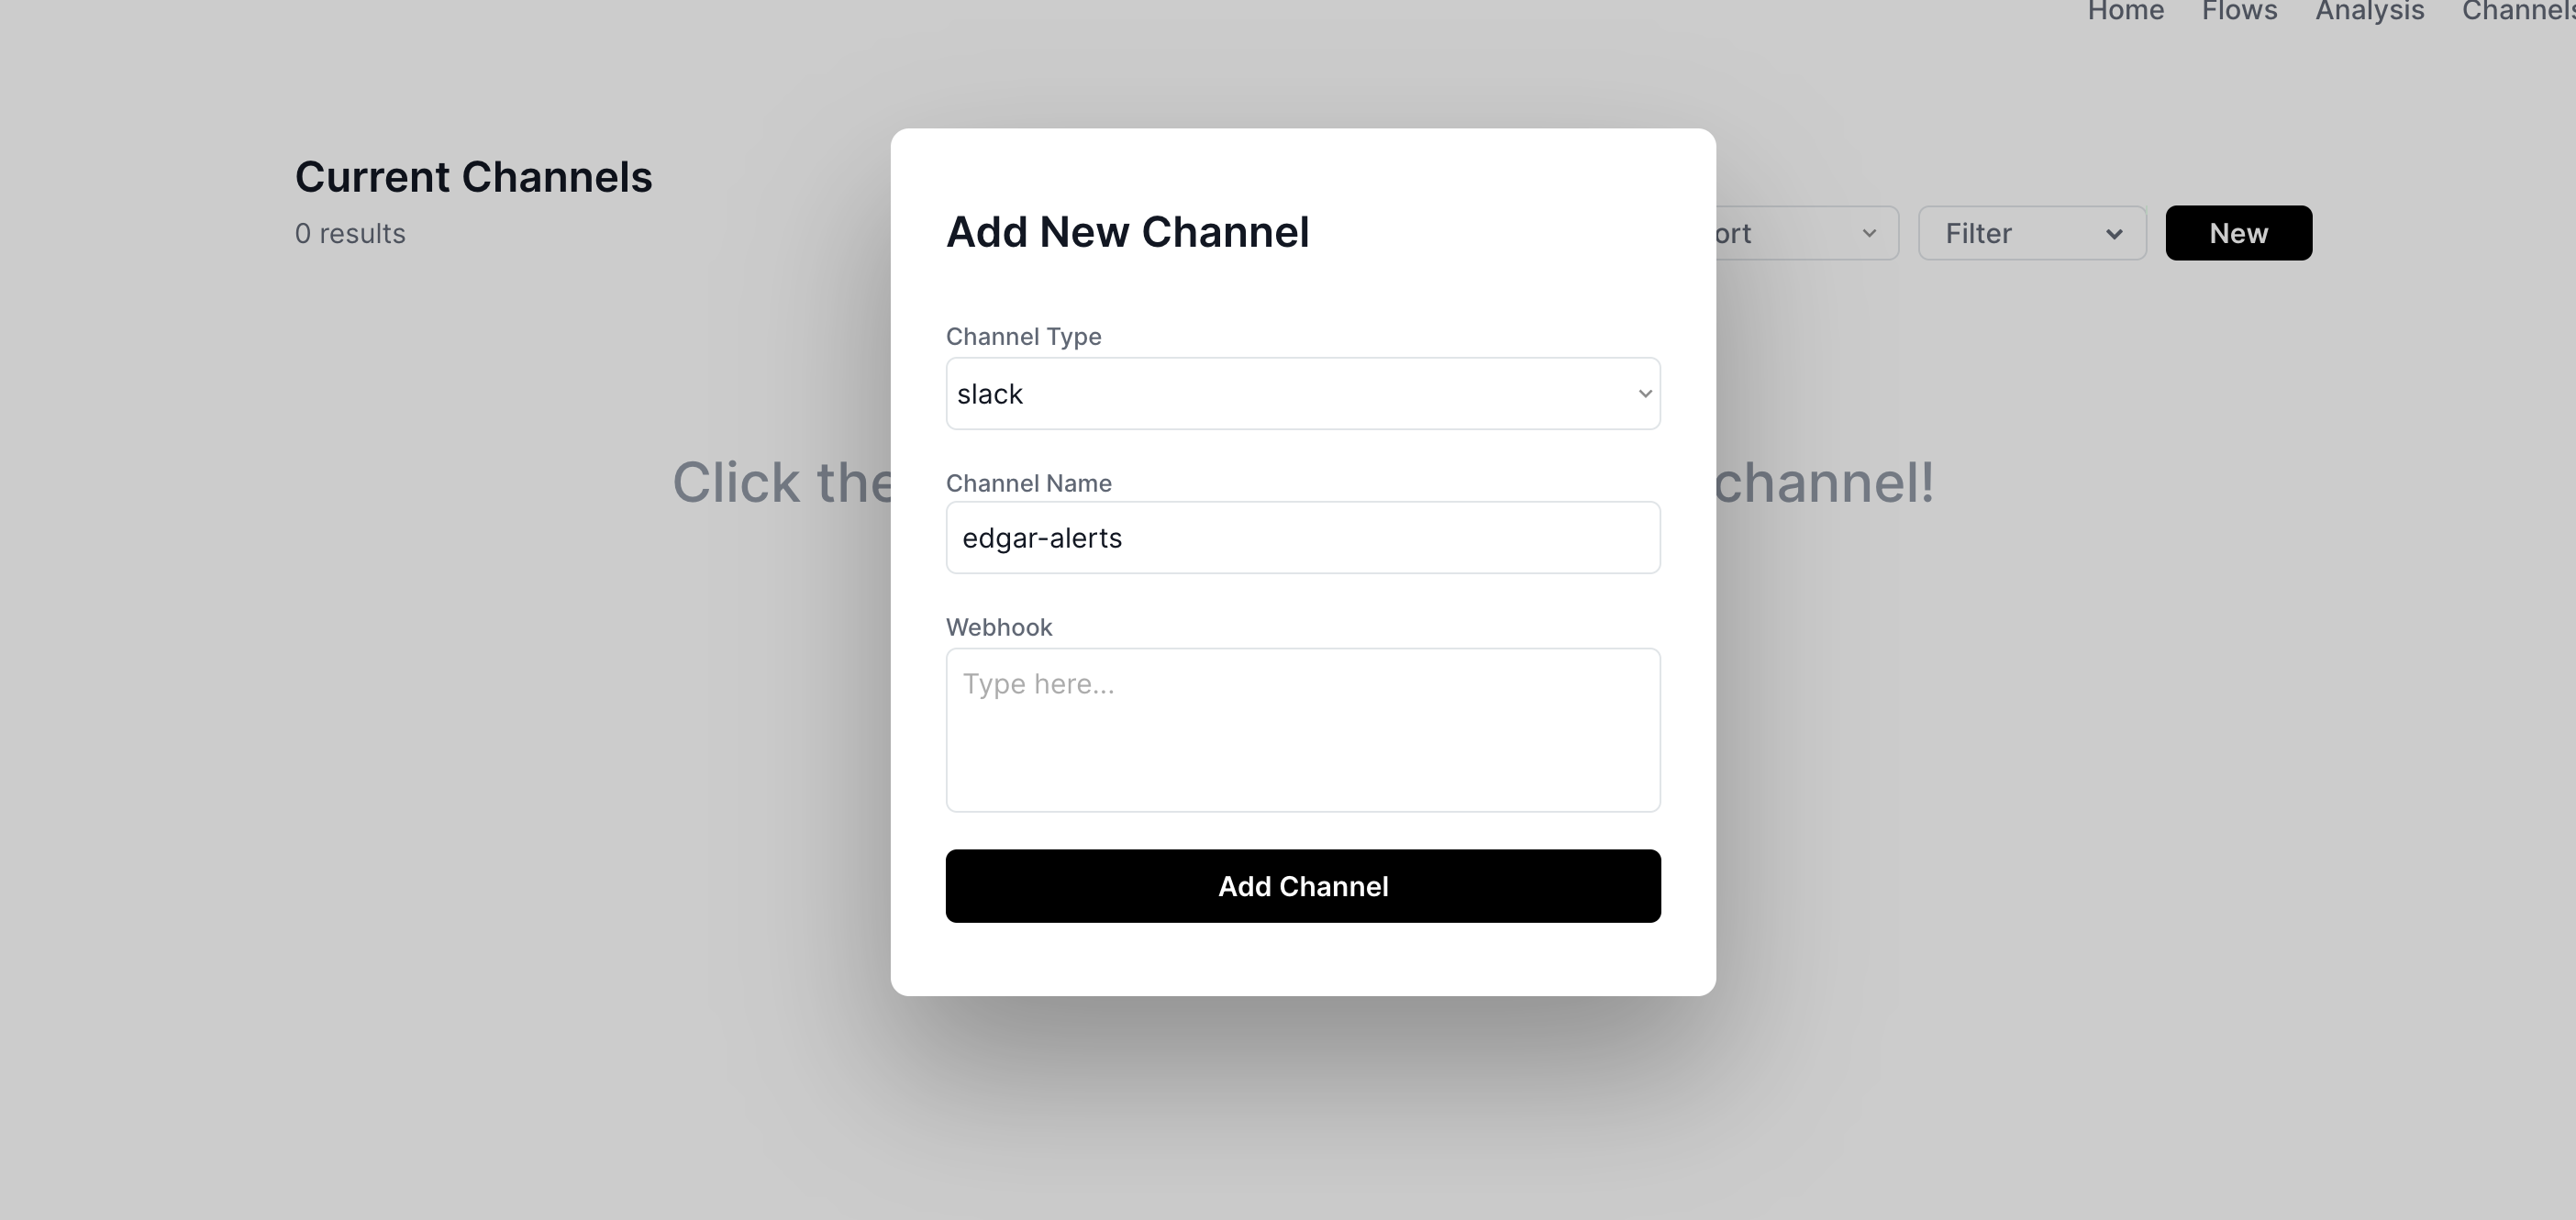
Setup live alerts for future signals
We can hook our flow up to a slack channel in cyborg, so that we can monitor these events as they happen. First we add our slack channel to our channels list:
And then on the flows page click ... -> configure flow:
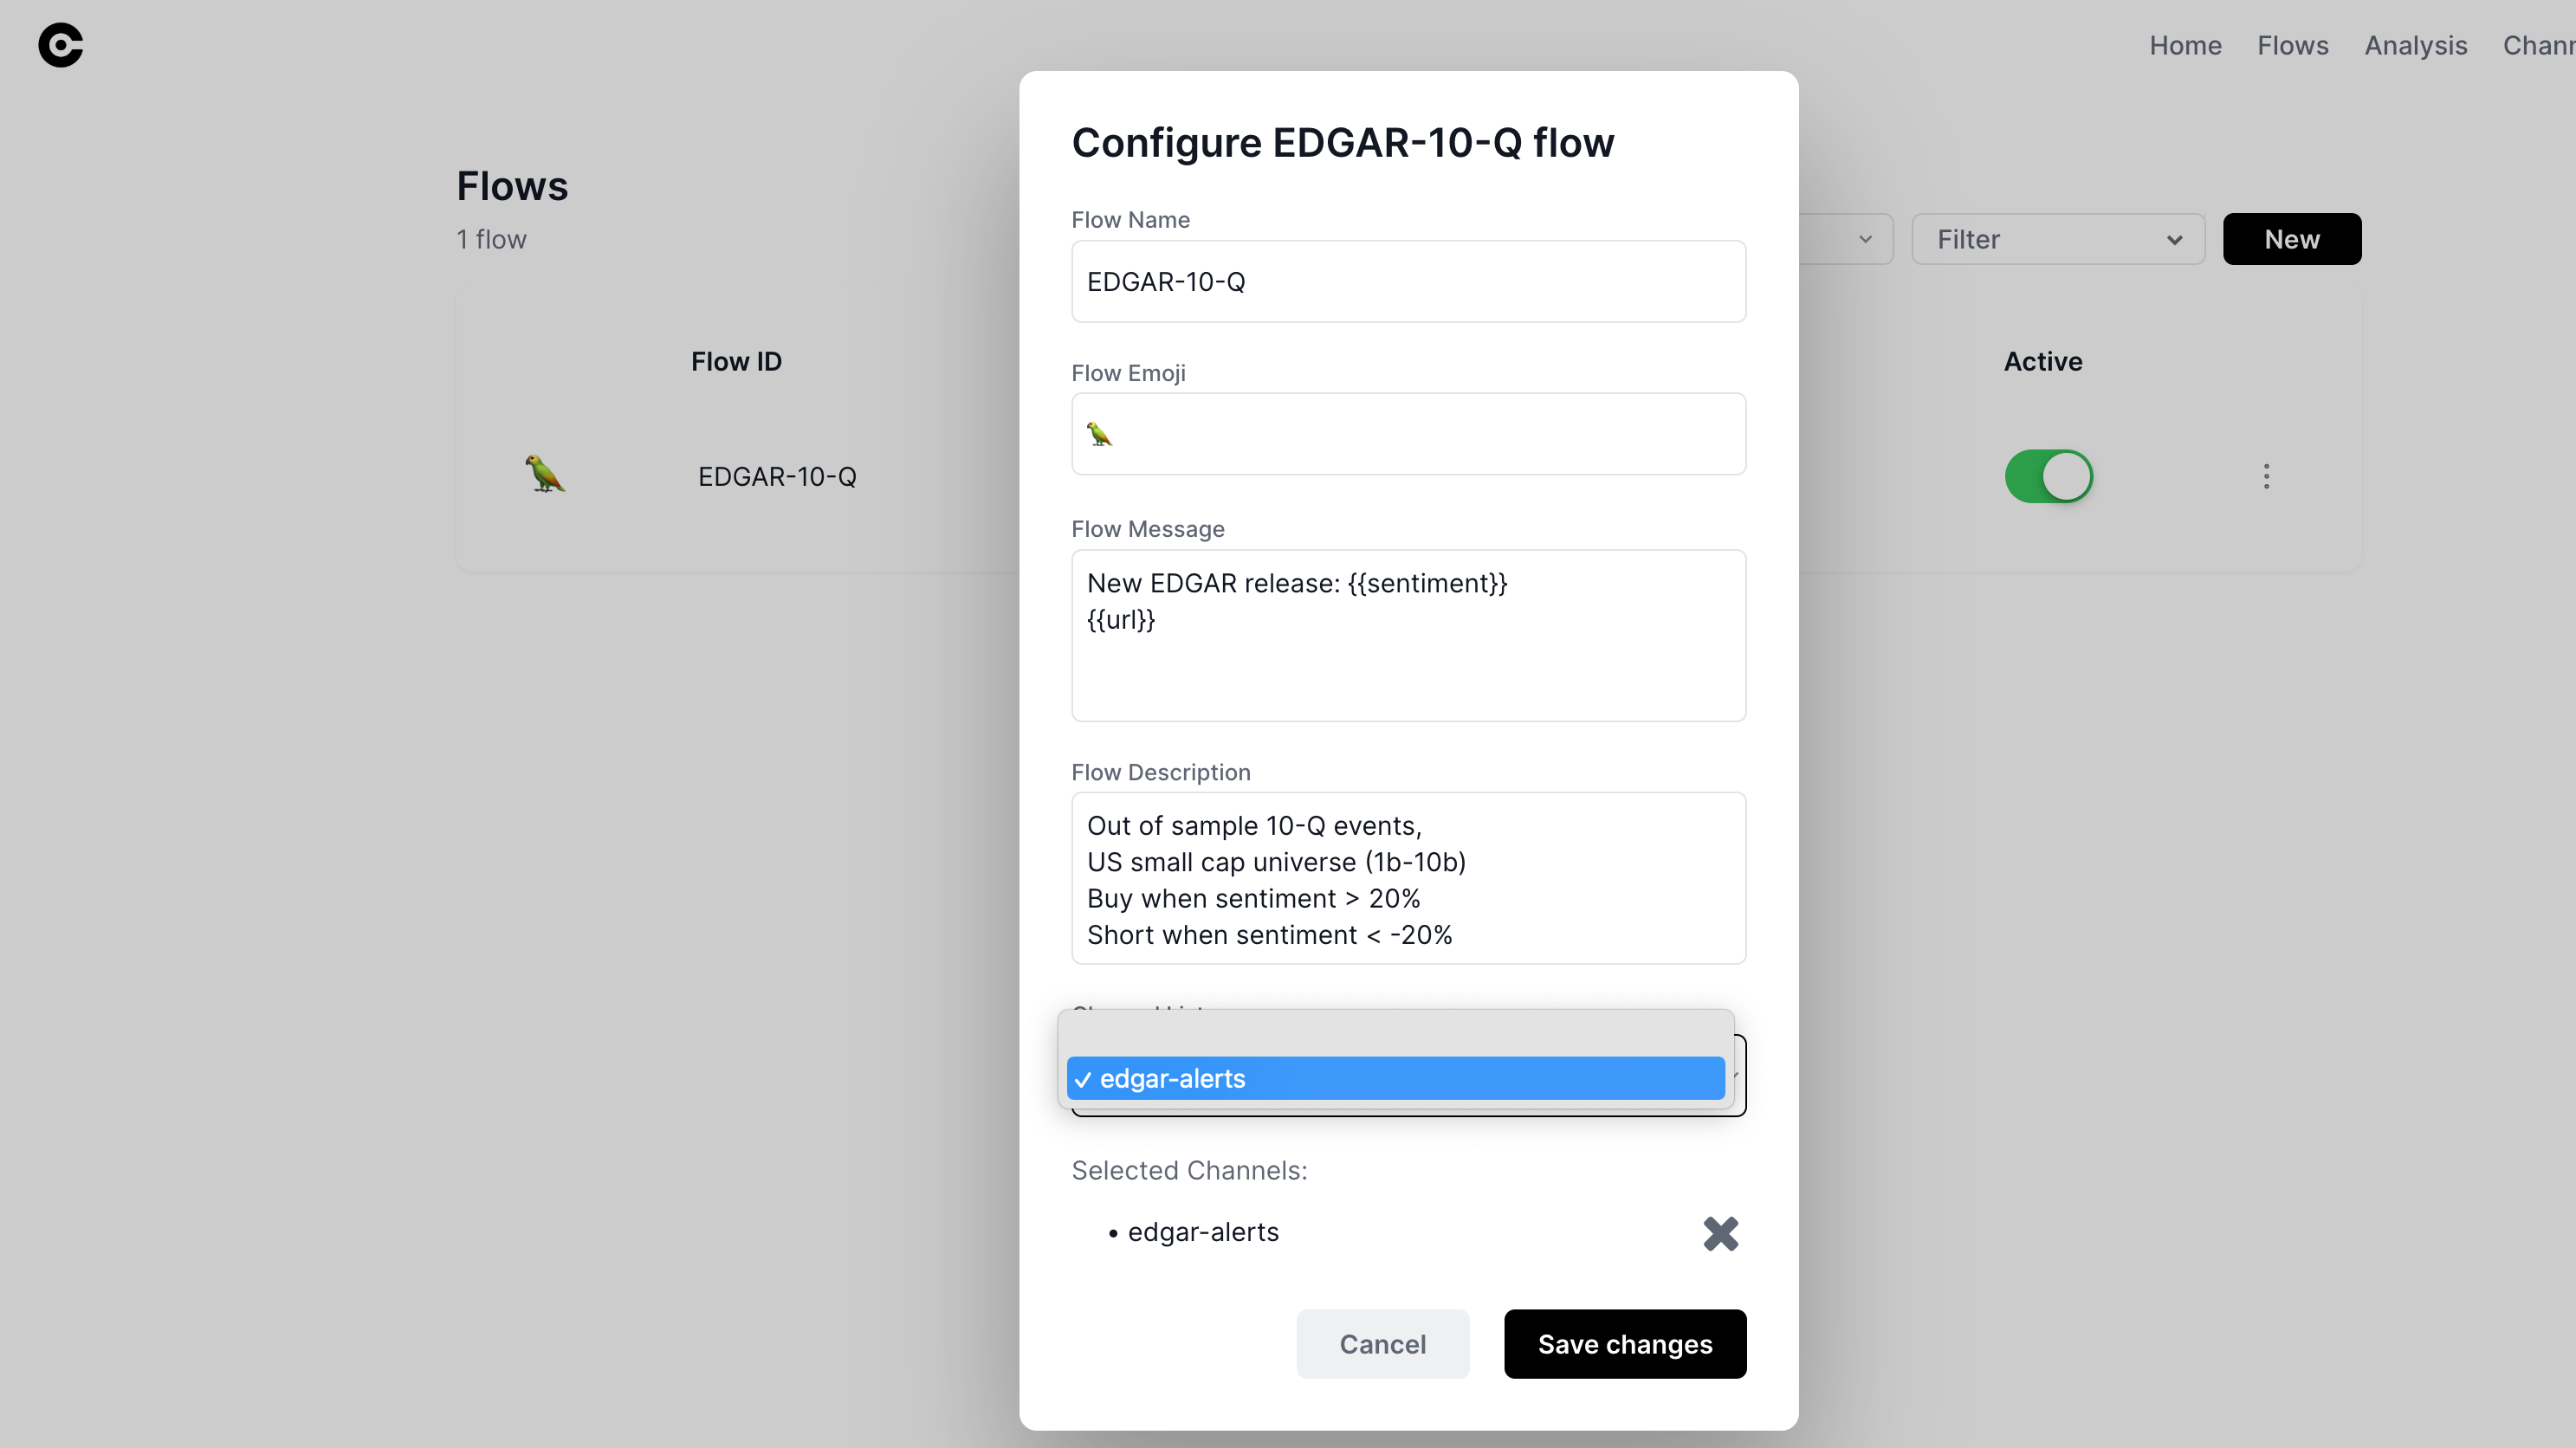
And attach the channel to the flow. Now all events will generate a message to this slack channel.
The final step is running the analysis code every morning to generate the new events, which can be done manually or we can do this with AWS lambdas - instructions in the aws_readme.txt.
Any questions contact us through the cyborg-notify.com chat in the bottom right hand corner - it goes directly to our slack!